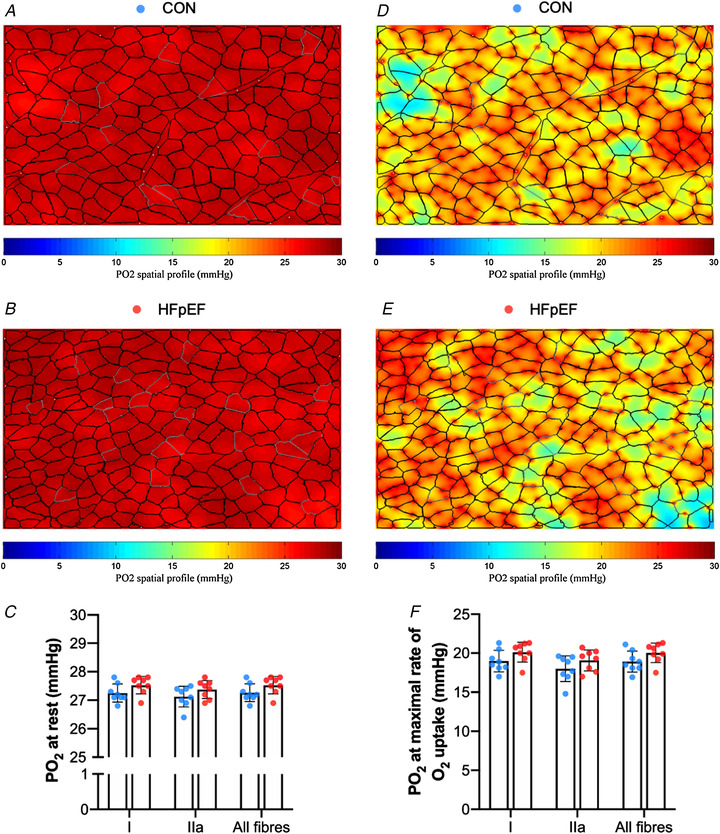
Figure 3. Modelling of soleus muscle oxygen tension.

Simulation of muscle PO2 at rest (A–B) and maximal rate of oxygen consumption (D–E) in representative images. There were no significant differences in simulations of muscle PO2 at rest (Type I fibres: 27.26 ± 0.33 vs. 27.54 ± 0.30 mmHg, P = 0.099; Type IIa: 27.12 ± 0.39 vs. 27.37 ± 0.31 mmHg, P = 0.16; all fibres: 27.25 ± 0.33 vs. 27.52 ± 0.29 mmHg, P = 0.102) (C) or at maximal rate of oxygen consumption (Type I: 18.97 ± 1.38 vs. 20.11 ± 1.27 mmHg, P = 0.109; Type IIa: 18.00 ± 1.64 vs. 19.07 ± 1.36 mmHg, P = 0.177; all fibres: 18.92 ± 1.36 vs. 20.02 ± 1.24 mmHg, P = 0.115) (F). Areas of muscle hypoxia (PO2 < 0.5 mmHg) are highlighted in blue. [Color figure can be viewed at wileyonlinelibrary.com]
