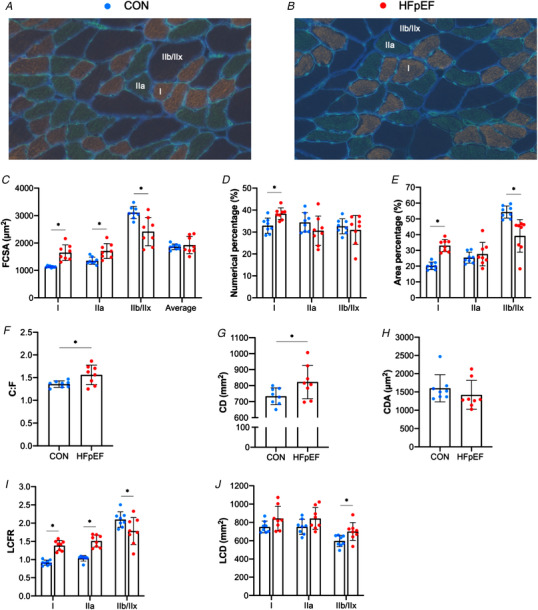
Figure 6. Histological features of the diaphragm.

Representative diaphragm sections from control (A) and obese‐HFpEF (B). Compared with lean controls, HFpEF rats had increased cross‐sectional area (CSA) in Type I (1130.67 ± 30.45 vs. 1647.83 ± 286.52 μm2; P < 0.001) and Type IIa fibres (1352.19 ± 133.46 vs. 1709.33 ± 273.24 μm2; P = 0.005), whereas CSA of Type IIb/IIx fibres was reduced (3109.90 ± 222.49 vs. 2418.50 ± 514.36 μm2; P = 0.004) (C). HFpEF rats also had a higher numerical percentage of Type I fibres (32.93 ± 3.46 vs. 38.38 ± 2.64 %; P = 0.003), although this remained unchanged in Type IIa (34.41 ± 4.39 vs. 30.65 ± 6.67 %; P = 0.203) and IIb/IIx fibres (32.63 ± 3.43 vs. 31.00 ± 6.63 %; P = 0.545) (D). Additionally, HFpEF rats showed a higher area percentage of Type I fibres (20.26 ± 2.37 vs. 33.12 ± 3.85 %; P < 0.001), whereas this was unchanged in Type IIa fibres (25.38 ± 3.50 vs. 27.66 ± 7.47 %; P = 0.449) and reduced in Type IIb/IIx fibres (54.36 ± 3.83 vs. 39.23 ± 10.33; P = 0.002) (E). HFpEF rats also showed general and local alterations in capillary distribution. General changes included increased capillary‐to‐fibre (C:F) ratio (1.96 ± 0.12 vs. 2.26 ± 0.28; P = 0.015) (F) and capillary density (CD) (733.42 ± 51.94 vs. 822.30 ± 104.43 mm2; P = 0.049) (G), although capillary domain area (CDA) remained unchanged (1600.57 ± 371.08 vs. 1420.58 ± 392.25 μm2; P = 0.362) (H). Local changes included increased LCFR in Type I (0.92 ± 0.08 vs. 1.39 ± 0.14; P < 0.001) and Type IIa fibres (1.05 ± 0.04 vs. 1.51 ± 0.16; P < 0.001) and reduced local capillary‐to‐fibre ratio (LCFR) in glycolytic/Type IIb/IIx fibres (2.13 ± 0.21 vs. 1.78 ± 0.37; P = 0.040) (I). In contrast, however, HFpEF rats had increased local capillary density (LCD) in Type IIb/IIx fibres (615.85 ± 45.69 vs. 700.85 ± 97.37 mm2; P = 0.042), with no changes in Type I (765.26 ± 60.76 vs. 843.27 ± 132.38 mm2; P = 0.152) and Type IIa fibres (763.78 ± 68.71 vs. 842.75 ± 119.64 mm2; P = 0.128) (J). [Color figure can be viewed at wileyonlinelibrary.com]
