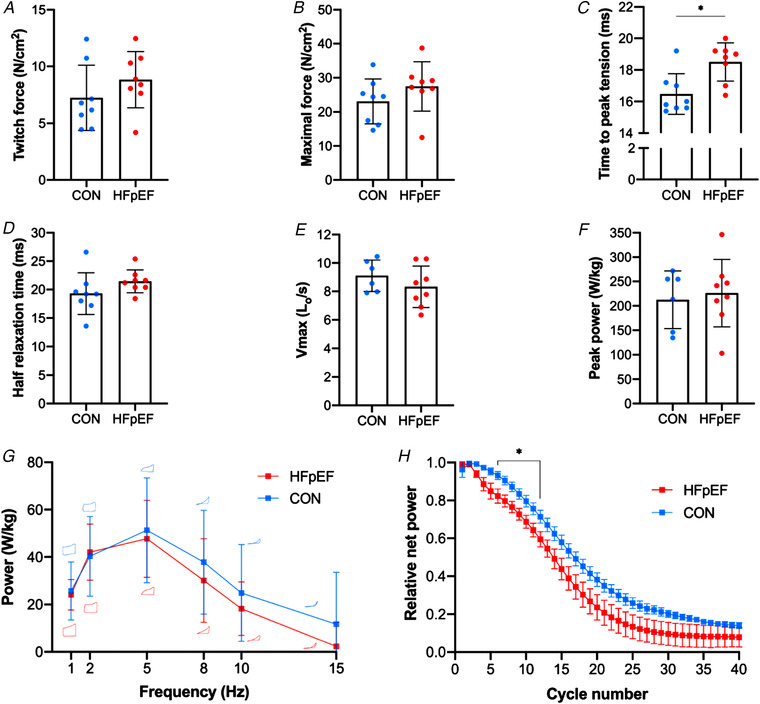
Figure 8. Functional properties of the diaphragm.

Isometric twitch and tetanic stress of the diaphragm were not different between groups (7.24 ± 2.87 vs. 8.83 ± 2.47 N/cm2, P = 0.254 and 23.09 ± 6.56 vs. 27.46 ± 7.22 N/cm2, P = 0.225, respectively) (A–B). In contrast, HFpEF rats showed slowed time‐to‐peak tension (16.48 ± 1.29 vs. 18.50 ± 1.21 ms; P = 0.006) (C), although half relaxation time was not significantly affected (19.30 ± 3.68 vs. 21.45 ± 2.02 ms; P = 0.170) (D). There were no differences in maximal shortening velocity (Vmax) (9.10 ± 1.11 vs. 8.32 ± 1.46 Lo/s; P = 0.278) (E) or peak isotonic power (212.56± 59.28 vs. 226.11 ± 69.36 W kg−1; P = 0.701) (F) between groups. During cyclical contractions, while the net power‐cycle frequency relationship remained unaltered between groups (P > 0.05; typical work loops are shown at each cycle frequency for each group) (G), relative fatigue was greater in HFpEF (P < 0.001) under cycles 6–12 (H). [Color figure can be viewed at wileyonlinelibrary.com]
