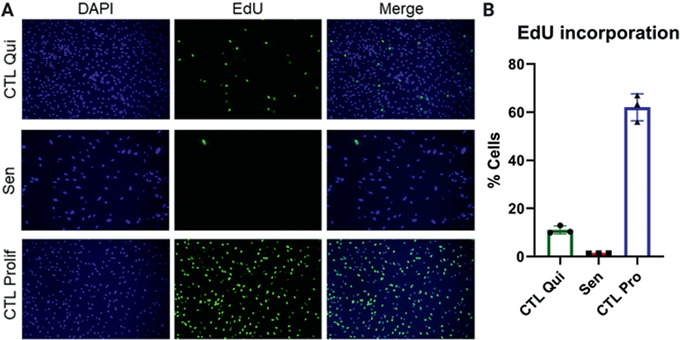
Figure 2.

EdU incorporation. (A) Representative images of quiescent control (top), ionizing radiation (IR)‐induced senescent (center), and proliferating control IMR‐90 cells (bottom). DAPI staining is shown on the left and EdU staining in the middle. Merged images are shown on the right. (B) Quantification of EdU‐positive cells for quiescent control, IR‐induced senescent, and proliferating control cells. Data shown are means of 3 replicates ± SD.
