
Figure 4.
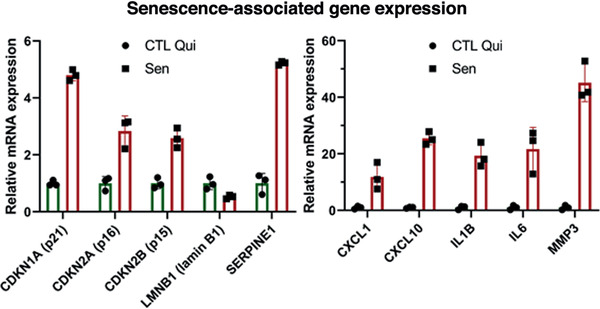
Gene expression analysis using qPCR. Relative mRNA levels of the indicated genes in senescent cells normalized to quiescent IMR‐90 cells. Data shown are means of 3 replicates ± SD.
Official websites use .gov
A
.gov website belongs to an official
government organization in the United States.
Secure .gov websites use HTTPS
A lock (
) or https:// means you've safely
connected to the .gov website. Share sensitive
information only on official, secure websites.
Gene expression analysis using qPCR. Relative mRNA levels of the indicated genes in senescent cells normalized to quiescent IMR‐90 cells. Data shown are means of 3 replicates ± SD.