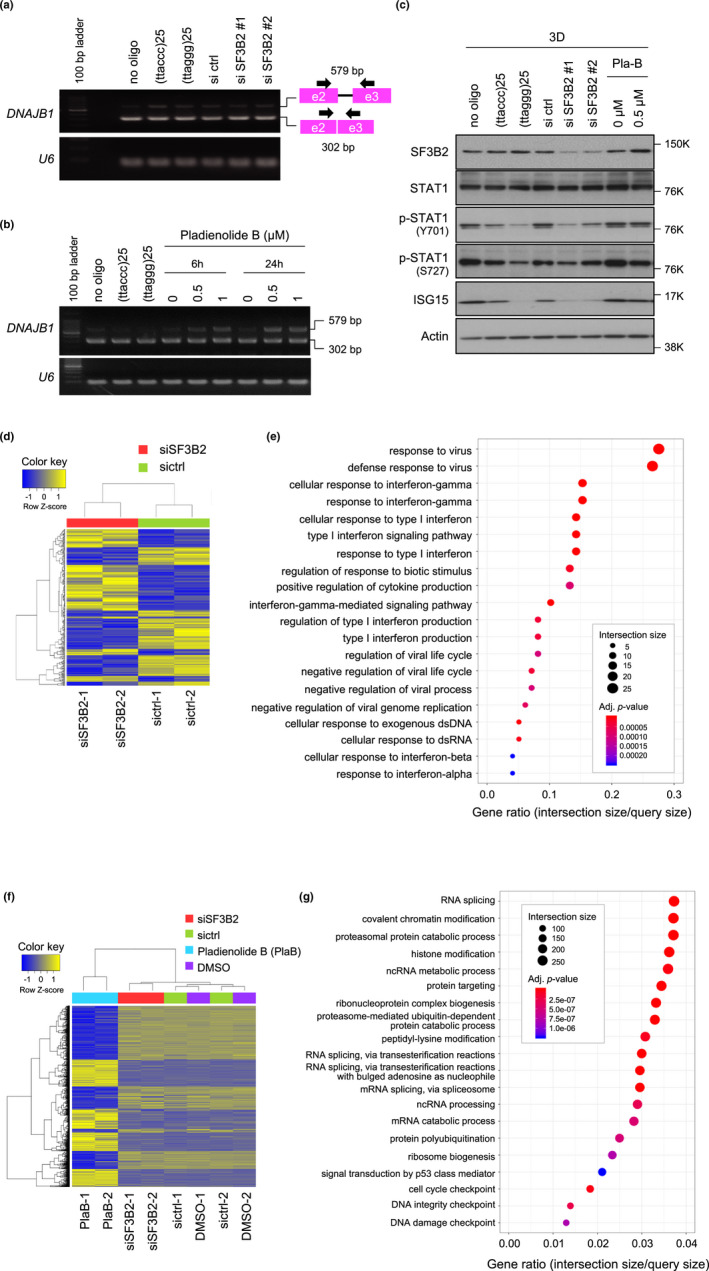
Figure 5.

Pharmacological inhibition of RNA splicing is not associated with repression of STAT1 signaling. (a) Effect of SF3B2 knockdown on pre‐mRNA splicing. PC3 cells were transfected with SF3B2 siRNAs and cultured for 72 hr. RNAs were prepared, and RT‐PCR was performed to analyze the splicing state of DNAJB1 transcripts. Because the PCR primers were designed to span two exons, unspliced mRNA products were larger than the spliced mRNA. U6 RNA is shown as an internal control. Arrow and square indicate the PCR primer and exon, respectively. (b) Effect of pladienolide B on pre‐mRNA splicing. PC3 cells were treated with 0.5 or 1 µM pladienolide B for 6 or 24 hr. After 72 hr of culture, RT‐PCR was performed as described in (a). (c) Effect of pladienolide B on STAT1 signaling. PC3 cells were treated with the indicated concentrations of pladienolide B, and then, cell lysates were subjected to Western blot analysis with the indicated primary antibodies. (d) Hierarchical cluster analysis (Euclidean method, complete linkage) of RNA‐seq data from PC3 cells transfected with control or SF3B2 siRNAs. A heat map was drawn using 285 genes with a fold change of >2 and exactTest raw p‐value of <.05. (e) Gene ontology (GO) analysis of down‐regulated genes in SF3B2‐depleted cells in (d). The top 20 GO categories of biological processes identified by g:Profiler are indicated. (f) Hierarchical cluster analysis of RNA‐seq data from PC3 cells transfected with control or SF3B2 siRNAs or treated with 0.5 µM pladienolide B or DMSO for 24 hr. A heat map was drawn using the top 3,000 genes of 11,306 genes with a fold change of >2 and exactTest raw p‐value of <.05 listed in more than at least one of the comparison pairs: SF3B2 siRNA versus control siRNA; pladienolide B versus DMSO; SF3B2 siRNA versus pladienolide B. (g) GO analysis of genes with altered expression in pladienolide B‐treated PC3 cells in (f)
