
FIGURE 1.
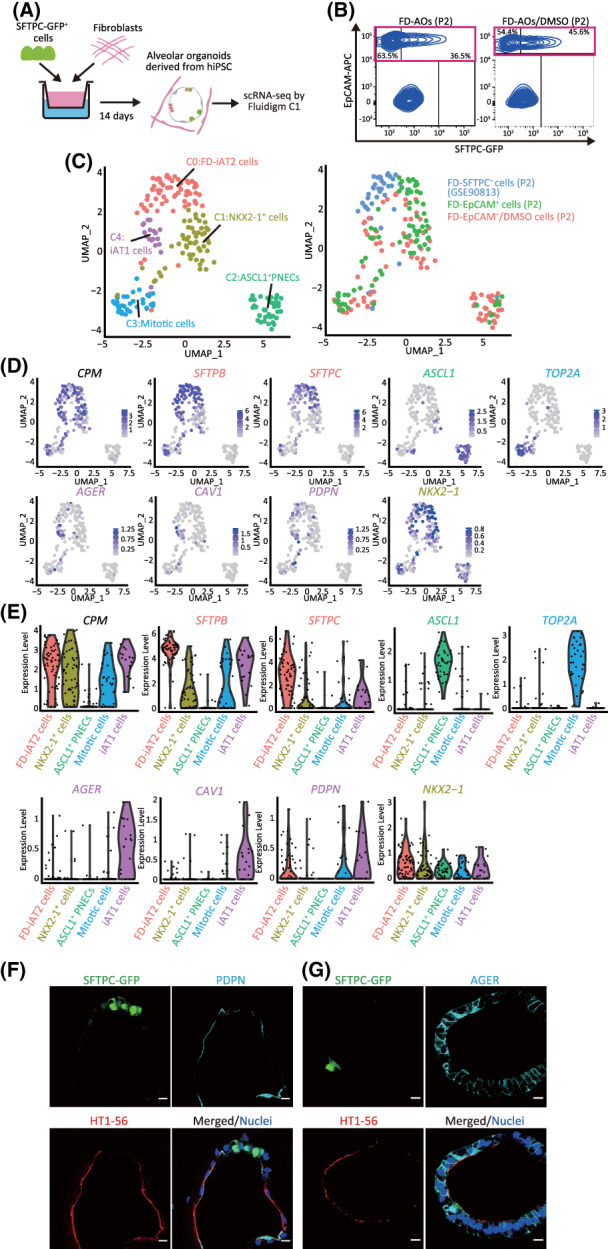
Identification of iAT1 cells in FD‐AOs. A, A schematic representation of the analysis of scRNA‐seq in FD‐AOs. FD‐EpCAM+ cells (P2) were collected from two independent FD‐AOs using FACS, followed by single‐cell isolation using a Fluidigm C1 system and RNA sequencing. Bioinformatics data were processed using Seurat (version 3.1.2) including FD‐SFTPC+ cells (P2) (GSE90813). B, Flow cytometric analyses of FD‐AOs (P2) with or without treatment with DMSO from day 2 to 14 before being subjected to scRNA‐seq. C, UMAP plots displaying cell clusters of FD‐EpCAM+ cells (P2) in FD‐AOs. We defined five major types of FD‐EpCAM+ cells: iAT1 cells, FD‐iAT2 cells, mitotic cells, ASCL1+ PNECs, and NKX2‐1+ cells. D, UMAP plots showing the expression of the selected marker genes; AT1 cells (AGER, CAV1, and PDPN), AT2 cells (SFTPB and SFTPC), mitotic cells (TOP2A), ASCL1+ PNECs (ASCL1), NKX2‐1+ cells (NKX2‐1), and alveolar epithelial cells (CPM). E, Violin plots showing the gene expression distributions of the selected marker genes across cell types. F,G, Immunostaining of AT1 markers (HT1‐56, PDPN, and AGER) and SFTPC‐GFP in FD‐AOs (P3). Scale bars = 10 μm. DMSO, dimethyl sulfoxide; FACS, fluorescence‐activated cell sorting; FD‐AOs, fibroblast‐dependent alveolar organoids; scRNA‐seq, single‐cell RNA sequencing; UMAP, uniform manifold approximation and projection