FIGURE 3.

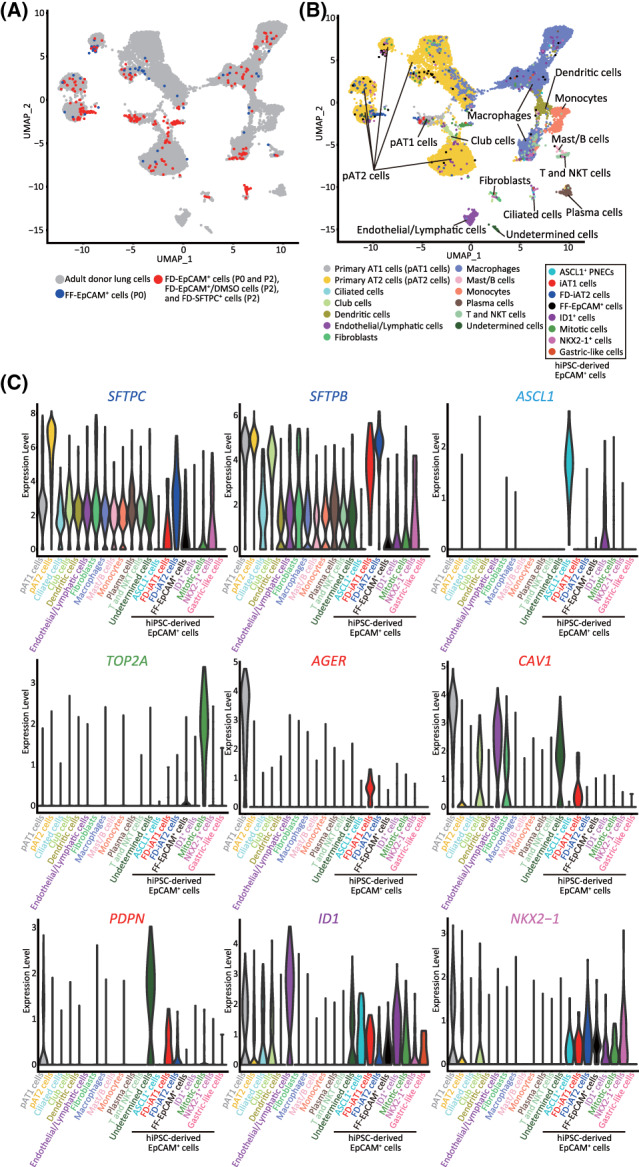
The transcriptomic profiles of iAT1 cells were similar to those of primary AT1 cells. A,B, Combined UMAP plots of single cells from FD‐EpCAM+ cells (P0 and P2), FD‐EpCAM+/DMSO cells (P2), FD‐SFTPC+ cells (P2), and FF‐EpCAM+ cells (P0) and adult donor lung cells extracted from the database (GSE122960) described in Figure S6. Adult donor lung cells are shown in gray, FD‐EpCAM+ cells (P0 and P2), FD‐EpCAM+/DMSO cells (P2), and FD‐SFTPC+ cells (P2) in red, and FF‐EpCAM+ cells (P0) in blue (A). UMAP plots revealed 13 clusters in adult donor lung cells and 8 clusters in FD‐EpCAM+ and FF‐EpCAM+ cells (B). C, Violin plots showing the gene expression distributions of the representative markers indicated in Figure 1C. AT1, alveolar type I
