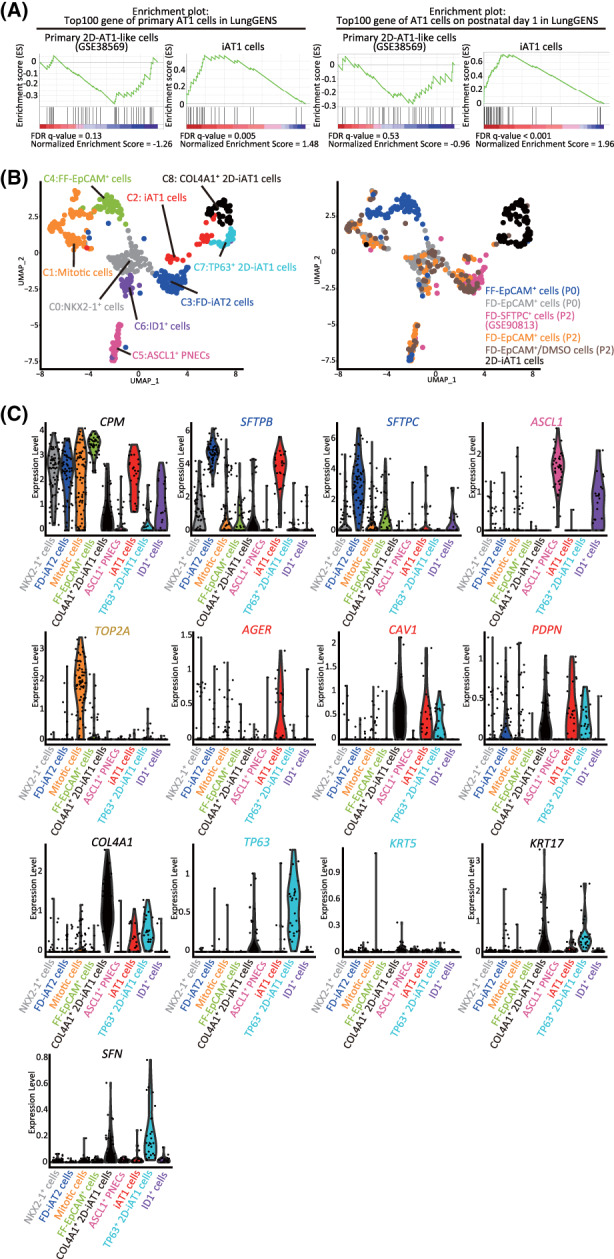
FIGURE 4.

The transcriptomes of iAT1 cells were more similar to those of primary AT1 cells than those of 2D‐AT1‐like cells. A, GSEA using the top 100 gene sets of primary AT1 cells or AT1 cells on human postnatal day 1 from the LungGENS database. Significantly up‐ or downregulated genes (P < .05) ranked by the log difference in average gene expression between FD‐iAT2 and iAT1 cells, or primary 2D‐AT1‐like and AT2 cells (GSE38569) were used for the analysis. B, UMAP plots of 2D‐iAT1 cells added to those of Figure 2C. FD‐SFTPC+ cells (P2) were differentiated in 2D cultures for 7 days and subjected to scRNA‐seq. Next, scRNA‐seq was performed and sequencing data, including that of FD‐EpCAM+ cells (P0 and P2), FD‐EpCAM+/DMSO cells (P2), FD‐SFTPC+ cells (P2), and FF‐EpCAM+ cells (P0), were analyzed. C, Violin plots showing the gene expression distributions of the representative lineage markers with COL4A1, TP63, KRT5, KRT17, and SFN for characterizing 2D‐iAT1 cells. AT1, alveolar type I; GSEA, gene set enrichment analysis; scRNA‐seq, single‐cell RNA sequencing
