
FIGURE 5.
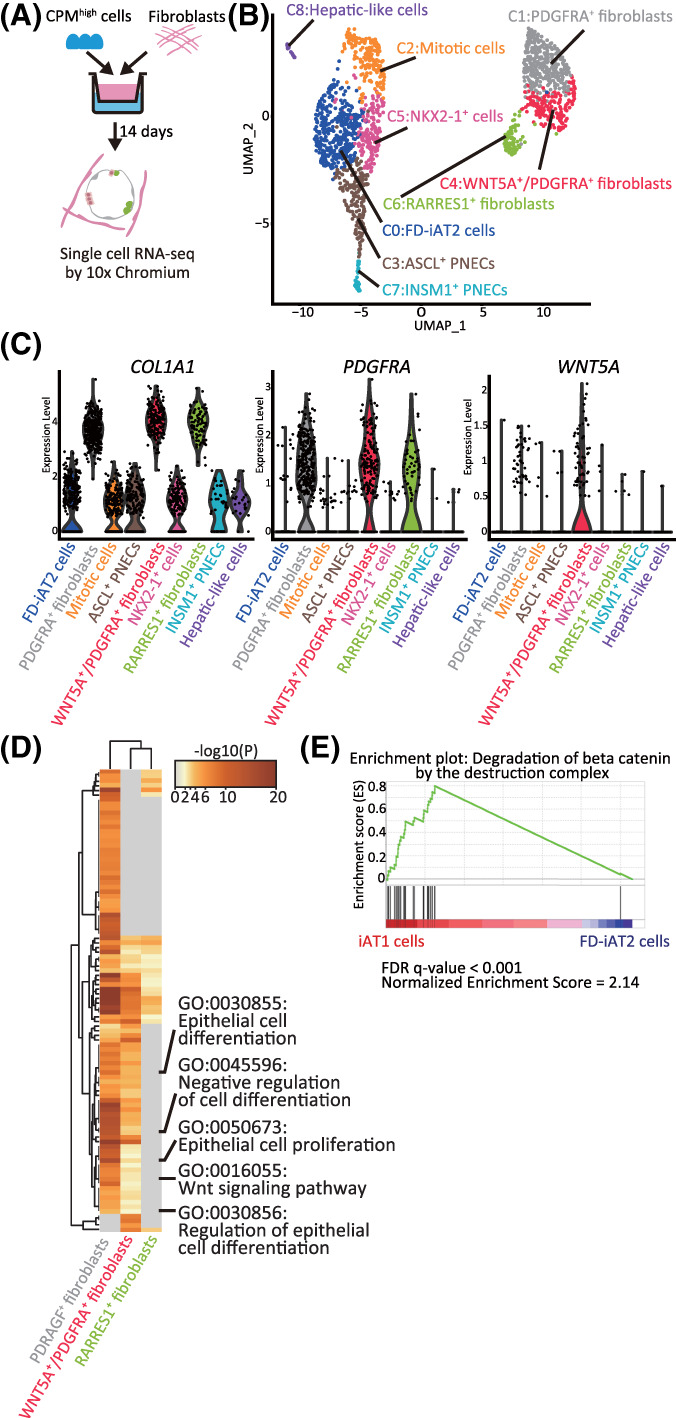
The transcriptomes of HFLF and hiPSC‐derived EpCAM+ cells in FD‐AOs. A, A schematic diagram of scRNA‐seq analysis of FD‐AOs. B, UMAP plots displaying cell clusters in FD‐AOs. Six major types of FD‐EpCAM+ cells (FD‐iAT2 cells, mitotic cells, ASCL1+ PNECs, INSM1+ cells, NKX2‐1+ cells, and hepatic‐like cells) and three types of fibroblasts (PDGFRA+, WNT5A+/PDGFRA+, and RARRES1+ fibroblasts) were identified. C, Violin plots indicating the gene expression distributions of each fibroblast cluster marker genes. D, Pathway enrichment analysis of PDGFRA+, WNT5A+/PDGFRA+, and RARRES1+ fibroblasts. Significantly upregulated genes (P < .05) among PDGFRA+, WNT5A+/PDGFRA+, or RARRES1+ fibroblasts compared with either or both of the other cell clusters were used for analysis. The top 100 differential pathways with a P < .05 are shown. E, GSEA using the gene set of β‐catenin degradation by the destruction complex. Significantly up‐ or downregulated genes (P < .05) ranked by the log difference in average gene expression between iAT1 cells and FD‐iAT2 cells were used for analysis. FD‐AOs, fibroblast‐dependent alveolar organoids; GSEA, gene set enrichment analysis; HFLF, human fetal lung fibroblasts; hiPSC, human induced pluripotent stem cell; scRNA‐seq, single‐cell RNA sequencing; UMAP, uniform manifold approximation and projection