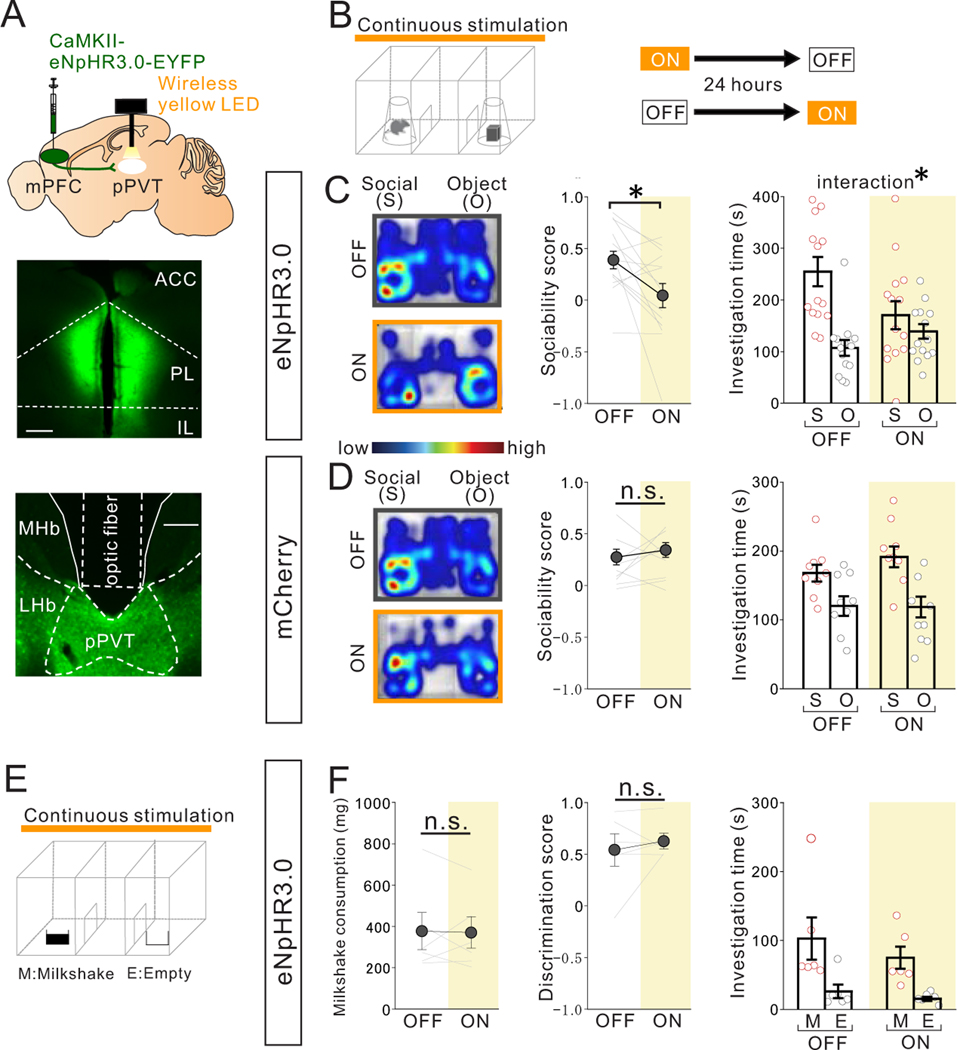
Figure 3. Optogenetic suppression of mPFC->pPVT projection terminal activity reduces sociability in adult group-housed mice.
(A) (Upper) Halorhodopsin NpHR3.0 AAV under the CamKII promotor was injected into mPFC and mPFC->pPVT projection terminals were optically stimulated in the pPVT using a wireless yellow LED system. Representative images of mPFC (middle) and pPVT (lower) show selective transduction of halorhodopsin at injection areas in the mPFC and the projection target areas in the pPVT where optic fibers are located. (middle; Scale bar = 600 μm, lower; Scale bar = 300 μm). Experimental images were obtained from 14 mice, three images per mouse for each areas, with similar results obtained. (B) Mice underwent the 3 chamber test of sociability with (ON) or without (OFF) light stimulation. Order of ON and OFF sessions were counter-balanced for each behavior test with a 24 hour interval between tests. (C) Mice with optogenetic suppression showed reduced sociability scores (two tailed paired t-test, t13=2.769, *P=0.016, n=14 biologically independent mice) and loss of social preference in the 3 chamber sociability test (two-way RM ANOVA, light (ON/OFF) × stimulus (social/object) interaction F1,26 = 4.876, *P=0.036, effect of light F1,26 = 1.915, P=0.178, effect of stimulus F1,26 = 11.870, P=0.002). (D) However, control mCherry+ mice showed no difference in sociability score two tailed paired t-test, t8=0.722, P=0.491, n=9 biologically independent mice) and investigation time (two-way RM ANOVA, light (ON/OFF) × stimulus (social/object) interaction F1,16 = 0.700, P=0.415, effect of light F1,16 = 0.685, P=0.420, effect of stimulus F1,16 = 16.600, P=0.882×10⁻³, n=9 biologically independent mice). (E) Mice underwent a 3 chamber test of food preference with (ON) or without (OFF) light stimulation. ON and OFF session order is counter-balanced for each behavior test with a 24 hour interval between tests. (F) (left) Mice with optogenetic suppression showed no difference in milkshake consumption (two tailed paired t-test, t5=0.143, P=0.892, n=6 biologically independent mice), in food discrimination score (middle: two tailed paired t-test, t5=0.724, P=0.501, n=6 biologically independent mice), nor in investigation time (right: two-way RM ANOVA, light (ON/OFF) × stimulus (Milkshake/Empty) interaction F1,10 = 0.183, P=0.678, effect of light F1,10 = 1.478, P=0.252, effect of stimulus F1,10 = 12.020, P=0.006, n=6 biologically independent mice). Data in C, D, F are presented as mean +/− s.e.m.

