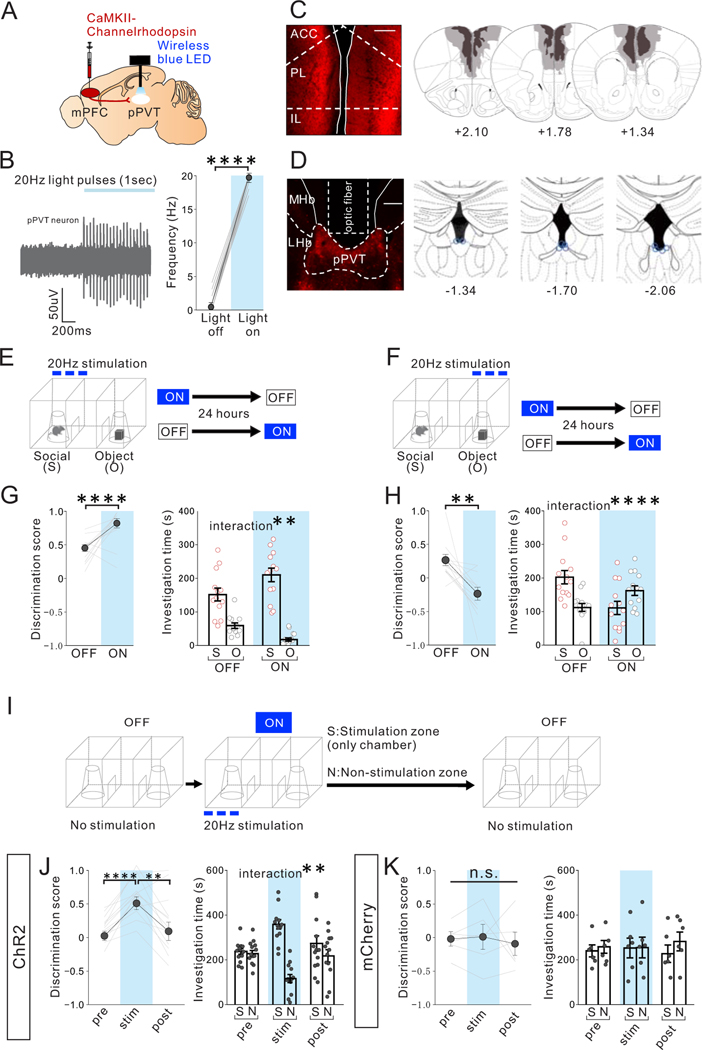
Figure 4. Optogenetic activation of mPFC->pPVT projection terminals biases sociability in adult group-housed mice.
(A) CaMKII-ChR2 AAV1 was injected into the mPFC and a wireless blue LED was inserted above the pPVT in group-housed (GH) mice. (B) (left) A representative in vivo unit recording of pPVT neurons showing reliable spikes upon optogenetic stimulation (20Hz) of mPFC->pPVT projection terminals. Traces Experimental images were obtained from 4 mice, 5–12 cells per mouse, with similar results obtained. (right) Quantification of light-induced firing rates of pPVT neurons (light OFF vs light ON (1 s each): two tailed paired t-test, t85=160.700, ****P=0.001×10⁻¹², n=86 cells from 4 biologically independent mice,). (C) (left) Representative images of injection area of mPFC neurons expressing ChR2. Scale bar: 600μm. Experimental images were obtained from 10 mice, three images per mouse, with similar results obtained. (right) Viral spread validation from behavior-tested mice. Gray areas represent the minimum (lighter colour) and the maximum (darker colour) spread of ChR2 expression in the mPFC. (D) (left) Representative pPVT image shows selective transduction of ChR2 below the area where optic fiber tips were inserted in the pPVT. Scale bar: 300μm. Experimental images were obtained from 10 mice, three images per mouse, with similar results obtained. (right) Optic fiber tip location (blue line circles) was validated in all mice. (E-H) GH adult mice underwent the 3-chamber test of sociability with (ON) or without (OFF) light stimulation. The order of ON and OFF sessions was counter-balanced with a 24 hour interval between tests. Optogenetic stimulation was delivered to activate the mPFC->pPVT projection whenever the mouse visited the (E) mouse interaction zone or (F) object zone and was terminated immediately if the mouse exited the mouse interaction zone during the 3 chamber sociability test. Order of ON and OFF sessions was counter-balanced with a 24-hour interval between tests. (G) Optogenetic activation in the social zone led to increased sociability scores (two tailed paired t-test, t9=4.788, ****P=0.990×10⁻³, n=10 biologically independent mice,) and increased social preference (two-way RM ANOVA, light (ON/OFF) × stimulus (social/object) interaction F1,18 = 12.860, **P=0.002, effect of light F1,18= 0.488, P=0.494, effect of stimulus F1,18 = 94.020, P=0.143×10⁻⁷, n=10 biologically independent mice). (H) Optogenetic activation in the object zone led to reduced sociability scores (two tailed paired t-test, t9=3.491, **P=0.007, n=10 biologically independent mice) and increased object zone preference (two-way RM ANOVA, light (ON/OFF) × stimulus (social/object) interaction F1,18 = 15.910, ****P=0.861×10⁻³, effect of light F1,18 = 1.227, P=0.282, effect of stimulus F1,18 = 0.282, P=0.602, n=10 biologically independent mice). (I-K) Optogenetic stimulation of mPFC->pPVT projection acutely promotes place preference. (I) Adult GH mice underwent the 3 chamber test without light stimulation (pre: OFF 10 mins), followed by a stimulation period (stim: ON 10 mins), and immediately followed by another period without light stimulation (post: OFF 10 mins). During the stimulation period, optogenetic stimulation was delivered to activate the mPFC->pPVT projection whenever the mouse visited the stimulation zone (S) and was terminated immediately if the mouse exited the stimulation zone. Location of stimulation zones are counter balanced. (J) ChR2+GH mice with optogenetic stimulation showed real-time preference to the stimulation zone (S) over the non-stimulation zone (N) as indicated by increased discrimination score (calculated as (S-N)/(S+N), one-way RM ANOVA, F1.585. 19.02 = 14.760, P=0.287×10⁻³, Tukey’s multiple comparisons test: pr e vs stim ****P=0.309×10⁻⁴, stim vs post **P=0.006) as well as investigation time (two-way RM ANOVA, time (pre/stim/post) × zone (stimulation zone/Non-stimulation zone) interaction F2,36 = 7.917, **P=0.001, effect of time F2,36 = 1.325, P=0.278, effect of zone F1,36 = 16.500, P=0.251×10⁻³, n=13 biologically independent mice). (K) Control mCherry+ mice showed no difference in discrimination score (one-way RM ANOVA, F1.125, 5.624= 0.2043, P=0.696, n=6 biologically independent mice) or investigation time (two-way RM ANOVA, time (pre/stim/post) × zone (stimulation zone/Non-stimulation zone) interaction F2,15 = 0.134, P=0.876, effect of time F2,15 = 0.073, P=0.930, effect of zone F1,15 = 0.345, P=0.566, n=6 biologically independent mice). Data in B, G, H, J, K are presented as mean +/− s.e.m.

