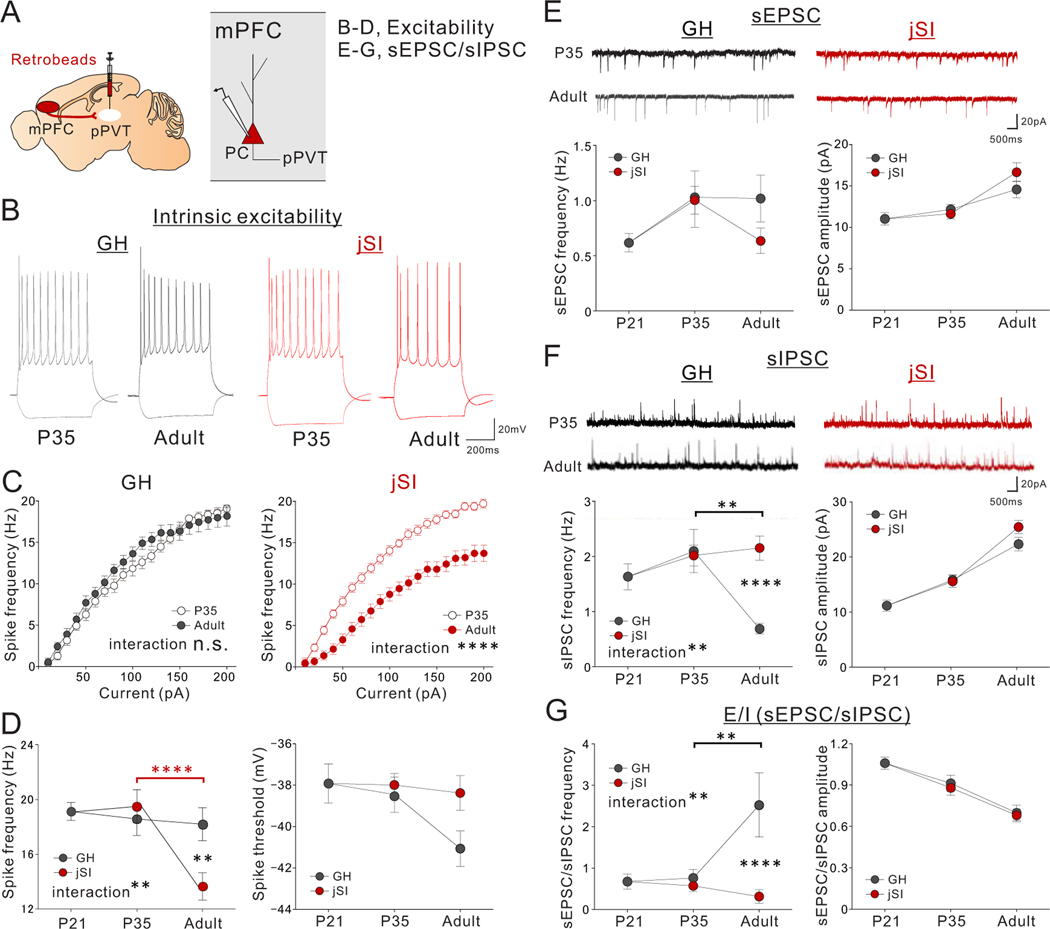
Figure 5. jSI leads to reduced intrinsic excitability and increased inhibitory input drive of mPFC->PVT neurons in adulthood.
(A) mPFC->pPVT neurons were labeled with retrobeads injected into the pPVT of mice underwent jSI (p21-p35) or GH. Whole-cell patch clamp recordings of mPFC->pPVT neurons were performed from mPFC slices of P21, P35 (jSI, GH), or adult (jSI, GH) mice. (B-D) Assessment of intrinsic excitability of mPFC-> pPVT neurons. (B) Representative traces in the presence of DNQX (20μM), D-AP5 (50μM), and picrotoxin (30μM) at −100pA and 200pA current steps. Traces are recorded from 20–23 cells from 7–9 biologically independent mice per group, with similar results obtained. (C) Input-output curve in P35 and Adult mice in GH (left: two-way RM ANOVA, housing x current step interaction F19,779 = 1.496, P=0.079, effect of current step F19,779 = 339.700, P=0.001×10⁻¹², effect of housing F1,41 = 0.226, P=0.637, n=21, 22 cells from 7, 7 biologically independent P35 or Adult mice in GH respectively) and jSI (right: two-way RM ANOVA, housing (GH/jSI) x current step interaction F19,779 = 10.790, ****P=0.001×10⁻¹², effect of current step F19,779 = 494.400, P=0.001×10⁻¹², effect of housing F1,41 = 41.830, P=0.935×10⁻⁷, n=20, 23 cells from 7, 9 biologically independent P35 or Adult mice in jSI respectively). (D) At the 200pA current step, jSI mice showed a significantly lower spike frequency compared with GH mice only after p35 during adulthood (two-way RM ANOVA, housing (GH/jSI) x age (P21/P35/Adult) interaction F2,126 = 6.171, **P=0.003, effect of housing F1,126 = 4.128, P=0.044, effect of age F2,126 = 12.380, P=0.123×10⁻⁴, Tukey’s multiple comparisons test: **P=0.001 (Adult: jSI vs GH), ****P=0.512×10⁻⁵ (jSI: p35 vs adult), n=23 cells from 6 biologically independent mice (p21), n=20 cells from biologically independent 7 jSI mice (p35), n=21 cells from biologically independent 7 GH mice (p35), n=23 cells from biologically independent 9 jSI mice (adult), and n=22 cells from biologically independent 7 GH mice (adult)). Spike threshold showed no significant difference between GH and jSI (two-way RM ANOVA, housing (GH/jSI) x age (P21/P35/Adult) interaction F2,126 = 1.447, P=0.239, effect of housing F1,126 = 2.265, P=0.135, effect of age F2,126 = 2.611, P=0.077). (E-G) Assessment of excitatory and inhibitory drive onto mPFC->pPVT neurons. n=23 cells from biologically independent 6 mice (p21), n=21 cells from biologically independent 7 jSI mice (p35), n=22 cells from biologically independent 7 GH mice (p35), n=22 cells from biologically independent 9 jSI mice (adult), and n=21 cells from biologically independent 9 GH mice (adult). (E) (upper) Representative traces of sEPSCs. Traces were recorded from 21–22 cells from 7–9 mice per group, with similar results obtained. (lower) sEPSC showed significant developmental changes but no difference between jSI and GH (Frequency: two-way RM ANOVA, housing (GH/jSI) x age (P21/P35/Adult) interaction F2,126 = 0.975, P=0.380, effect of housing F1,126 = 1.187, P=0.278, effect of age F2,126 = 3.423, P=0.036, Amplitude: two-way RM ANOVA, housing (GH/jSI) x age (P21/P35/Adult) interaction F2,126 = 1.375, P=0.257, effect of housing F1,126 = 1.335, P=0.250, effect of age F2,126 = 20.450, P=0.203×10⁻⁷). (F) (upper) Representative traces of sIPSCs. Traces were recorded from 21–22 cells from 7–9 mice per group, with similar results obtained. (lower left) sIPSC frequency in jSI mice failed to decrease between p35 and adulthood (two-way RM ANOVA, housing (GH/jSI) x age (P21/P35/Adult) interaction F2,126 = 6.146, **P=0.003, effect of housing F1,126 = 5.267, P=0.023, effect of age F2,126 = 3.400, P=0.036, Tukey’s multiple comparisons test: ****P=0.826×10⁻³ (Adult: jSI vs GH), **P=0.001 (GH: p35 vs adult)). (lower right) sIPSC amplitude showed significant developmental changes but no difference between jSI and GH (two-way RM ANOVA, housing (GH/jSI) x age (P21/P35/Adult) interaction F2,126 = 1.408, P=0.249, effect of housing F1,126 = 2.638, P=0.107, effect of age F2,126 = 89.870, P=0.001×10⁻¹²). (G) The ratio of sEPSC/sIPSC frequency was significantly different between GH and jSI only after p35 in adulthood. jSI mice did not show a late developmental increase in the ratio between p35 and adulthood as in GH mice did (two-way RM ANOVA, housing (GH/jSI) x age (P21/P35/Adult) interaction F2,126 = 6.667, **P=0.001, effect of housing F1,126 = 8.628, P=0.004, effect of age F2,126 = 3.310, P=0.040, Tukey’s multiple comparisons test: ****P=0.130×10⁻³ (Adult: jSI vs GH), **P=0.004 (GH: p35 vs adult)). The ratio of sEPSC/sIPSC amplitude showed developmental changes but no significant difference between jSI and GH groups (two-way RM ANOVA, housing (GH/jSI) x age (P21/P35/Adult) interaction F2,126 = 0.052, P=0.949, effect of housing F1,126 = 0.163, P=0.687, effect of age F2,126 = 26.770, P=0.204×10⁻⁹). Data in C-G are presented as mean +/− s.e.m.

