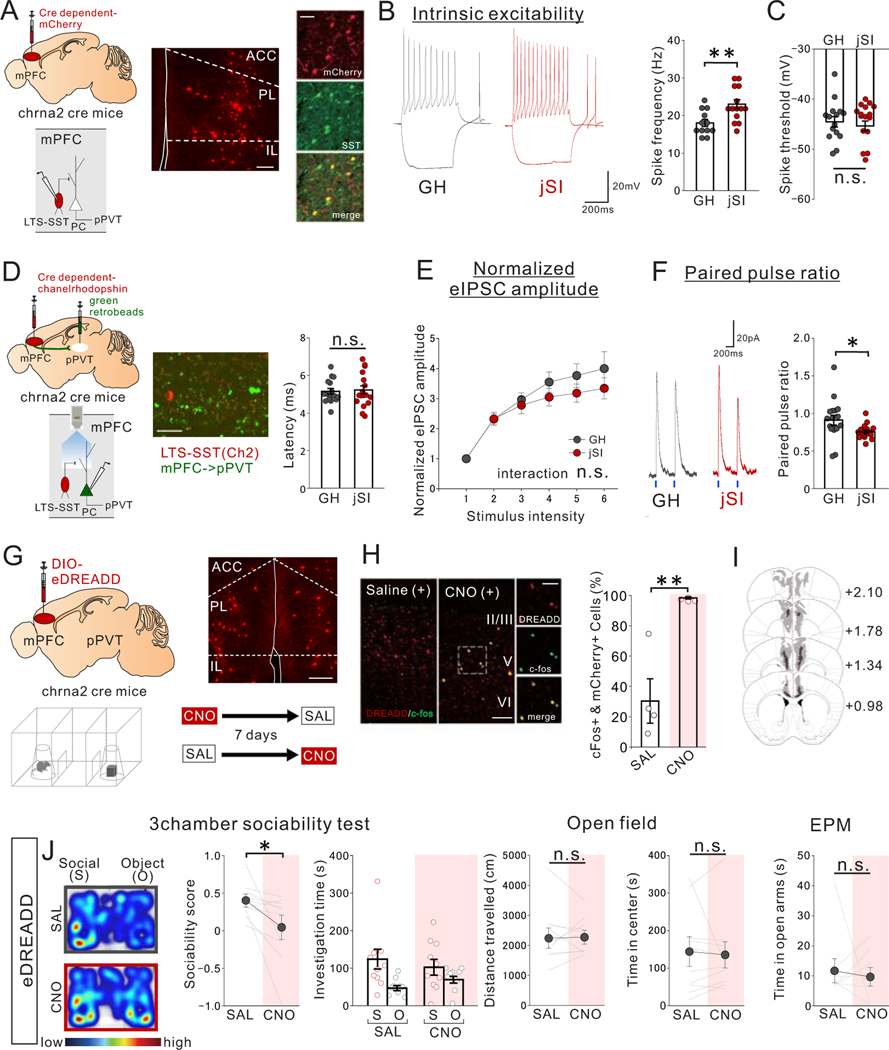
Figure 6. jSI leads to increased intrinsic excitability of mPFC LTS-SST interneurons and impaired LTS-SST to mPFC->pPVT synaptic transmission in adulthood.
(A-C) Whole-cell patch clamp recording from low threshold spiking (LTS)-somatostatin (SST) interneurons in mPFC slices of adult jSI or GH mice. (A) mPFC LTS-SST interneurons are fluorescently labeled by injecting a Cre-dependent mCherry vector into adult Chrna2-Cre mice. (middle) Representative image of Chrna2+LTS-SST interneurons expressing mCherry in the mPFC. (right) co-localization of mCherry and SST immunoreactivity (green) in the mPFC. Scale bar: 150 um (left), 50um (right) Experimental images were obtained from 6 mice, 3 images per mouse, with similar results obtained. (B) (left) Assessment of intrinsic excitability of Chrna2+ LTS-SST interneurons in the presence of DNQX (20μM), D-AP5 (50μM), and picrotoxin (30μM). (left) Representative traces at 200pA injection recorded from mPFC LTS-SST interneurons (traces were recorded from 12–14 cells from 7 biologically independent mice per group) and (right) quantification of spike frequency (two tailed t-test, n=14 cells from 7 biologically independent jSI mice, t24=3.186, **P=0.004, n=12 cells from 7 biologically independent GH mice). (C) There were no significant differences in spike threshold (two tailed t-test, t24=0.257, P=0.800, n=12 cells from 7 biologically independent GH mice, n=14 cells from 7 biologically independent jSI mice). (D-F) Optogenetic interrogation of LTS-SST interneuron input onto mPFC->pPVT projection neurons. (D) Cre-dependent ChR2 vector and green retrobeads were injected into the mPFC and pPVT, respectively, to express ChR2 in LTS-SST interneurons and fluorescently label mPFC->pPVT neurons for patch-clamp recordings. (middle) A representative image showing ChR2-mCherry+LTS-SST interneurons and retrobeads+mPFC->pPVT projection neurons in deep layer mPFC. Scale bar 50um. Experimental images were obtained from 3 mice, 16 images per mouse, with similar results obtained. (right) Latency of light-evoked IPSC of mPFC->pPVT neurons indicates monosynaptic inhibitory inputs from LTS-SST interneurons but indicates no significant difference between GH and jSI mice (two tailed t-test, t32=0.284, P=0.778, n=17 cells from 7 biologically independent mice for each group). (E) Stimulus Intensity–response amplitude curves of normalized eEPSC upon optical stimulation with a light intensity incrementally increased in a step-wise fashion (0.1mW/mm2/step) from the minimal stimulation level 1. Plotted eIPSC amplitudes were normalized to the amplitude of the response evoked by the minimal stimulation intensity for each patched cells individually to mitigate the impact of variations in viral expression levels. There were no significant differences in normalized eIPSC amplitude (two-way RM ANOVA, housing (GH/jSI) x light intensity step interaction F5,145 = 1.217, P=0.304, effect of housing F1,29 = 0.872, P=0.304, effect of light intensity step F5,145 = 52.460, P=0.001×10⁻¹², n=15 cells from 7 biologically independent GH mice, n=16 cells from 7 biologically independent jSI mice). (F) (left) eIPSCs elicited by optogenetic stimulation. Representative averaged waveform showing paired-pulse facilitation in eIPSCs at a 500-ms interval. Traces were recorded from 17 cells from 7 mice per group, with similar results obtained. (right) Quantification of paired pulse ratio (PPR), given by second evoked amplitude/first evoked amplitude (two tailed t-test, t32=2.220, *P=0.034, n=17 cells from 7 biologically independent mice for each group). (G-J) Chemogenetic activation of mPFC Chrna2+LTS-SST interneurons reduces sociability in adult GH mice. (G) (top left) Cre-dependent AAV8-DIO-eDREADD was injected into the mPFC of Chrna2-Cre mice. (top right) A representative image showing transduction of eDREADD-mCherry at injection areas in the mPFC. Scale bar: 150μm. Experimental images were obtained from 10 mice, four images per mouse, with similar results obtained. (bottom) Mice were treated with saline (SAL) or CNO (1mg/kg) and then underwent the 3 chamber test of sociability. For CNO and SAL injections, order was counter-balanced with a one-week interval between tests. (H) Co-localization analysis of c-Fos immunoreactivity and mCherry confirmed efficacy of the eDREADD virus in activating Chrna2+LTS interneurons. (left) Representative images for mice treated with SAL and CNO show significant co-localization between mCherry (red) and c-Fos (green) only in CNO-treated mice (Experimental images were obtained from 4 mice per group, 10 images per mouse, with similar results obtained) and quantification (two tailed t-test, t6=4.648, **P=0.004, n=4 biologically independent mice). Scale bar: 100um (left), 50um (right) (I) Viral spread validation of eDREADD expression from behavior-tested mice. Gray areas represent the minimum (lighter colour) and the maximum (darker colour) spread of eDREADD in the mPFC. (J) (left) CNO-treated eDREADD+ mice showed reduced sociability scores (two tailed paired t-test, t9=2.489, *P=0.034, n=10 biological independent mice). Breakdown of social and object investigation time (two-way RM ANOVA, drug (CNO/SAL) × stimulus (social/object) interaction F1,18 = 1.704, P=0.208, effect of drug F1,18 = 0.004, P=0.953, effect of stimulus F1,18 = 10.750, P=0.004, n=10 biologically independent mice). (right) eDREADD+ mice showed no differences in motor activity or anxiety-related behaviors when treated with SAL vs. CNO (Left; two tailed paired t-test, t9=0.167, P=0.871, n=10 biologically independent mice, Middle; two tailed paired t-test, t9=0.332, P=0.748, n=10 biologically independent mice, Right; two tailed paired t-test, t9=0.434, P=0.674, n=10 biologically independent mice). Data in B, C, E, F, H, J are presented as mean +/− s.e.m.

