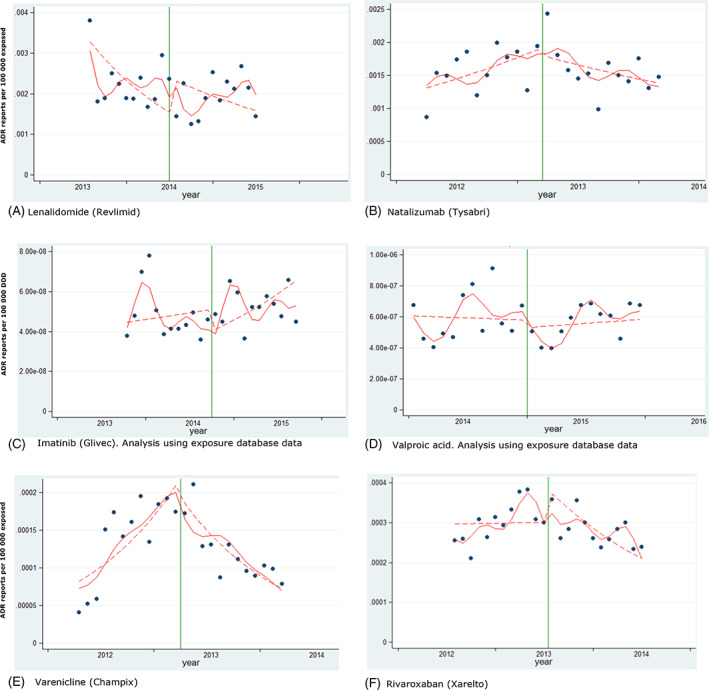
FIGURE 2.

Interrupted time series analysis. Products included in the study due to the requirement to conduct a PASS. Reporting of post‐marketing ADRs from the EEA. Green vertical line: addition to AM list. Red line: predicted reporting from seasonality‐adjusted model. Dashed line: de‐seasonalised trend [Colour figure can be viewed at wileyonlinelibrary.com]
