Figure 5.

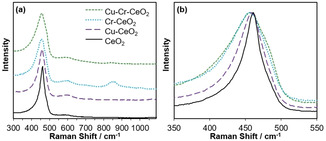
(a) Raman spectra of undoped and doped with 1 % Cu, 1 % Cr, and 1 % Cu/1 % Cr ceria nanorods, and (b) F2g Raman band for the same ceria samples.

(a) Raman spectra of undoped and doped with 1 % Cu, 1 % Cr, and 1 % Cu/1 % Cr ceria nanorods, and (b) F2g Raman band for the same ceria samples.