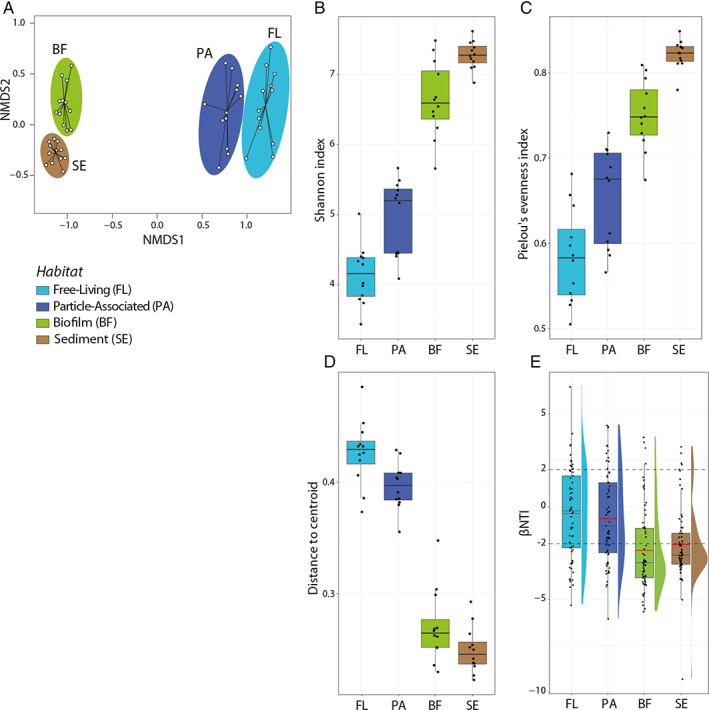
Fig 2.

A. Non‐metric multidimensional scaling (NMDS) resulting from Bray–Curtis dissimilarity matrices exhibited distinct differences in community composition between all four habitat types (PERMANOVA between all pairs: p‐value <0.005).
B. Increase in Shannon diversity index from FL, PA and through BF and SE.
C. Increase in Pielou's evenness indices again from FL to SE.
D. Distance to centroid in multivariate homogeneity of group variance analysis for lotic bacterial communities in four habitat types (A post hoc Tukey's HSD: marginal significance between FL and PA, p = 0.038; between BF and SE, p = 0.225, all other pairs were significant, p < 0.001; See Supplementary Table S2c).
E. β‐Nearest Taxon Index (βNTI) for all pairs of communities within each habitat. A mean βNTI (red lines: −0.3819, −0.6356, −2.353, −2.034 for free‐living, particle‐associated, biofilm and sediment habitats respectively) across all pairwise comparisons that is greater than +2 or less than −2 (dotted lines) as are seen in benthic communities (biofilm and sediment) suggests the influence of deterministic processes in microbial assembly.
