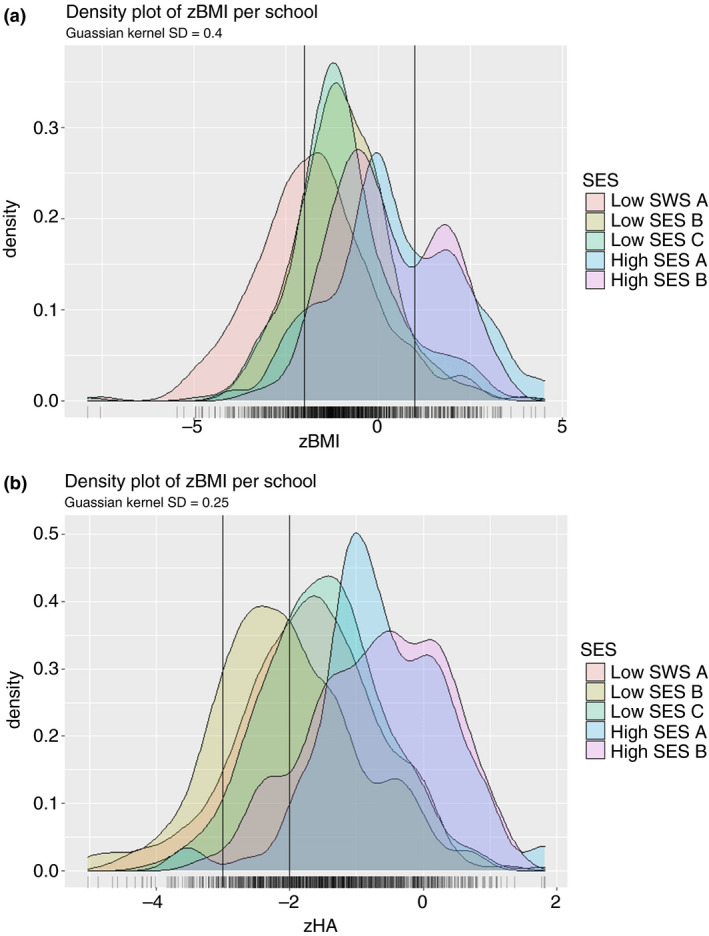
Figure 2.

Distribution of z‐BMI (a) and z‐HA (b) depicted in a density plot per school. (a) The leftmost vertical line is at a z‐BMI score of −2, indicating cut‐off between underweight and normal weight and the rightmost vertical line is at a score of +1, indicating the cut‐off between normal weight and overweight. Gaussian Kernel SD = 0.4. (b) The leftmost vertical line is at a z‐HA score of −3, indicating the cut‐off between severely stunted and stunted. The rightmost vertical line is at a z‐score of −2, indicating the cut‐off between stunted and normal height. Gaussian Kernel SD = 0.25. SD: standard deviation. z‐BMI: z‐score of body mass index for age. z‐HA: z‐score of height for age. [Colour figure can be viewed at wileyonlinelibrary.com]
