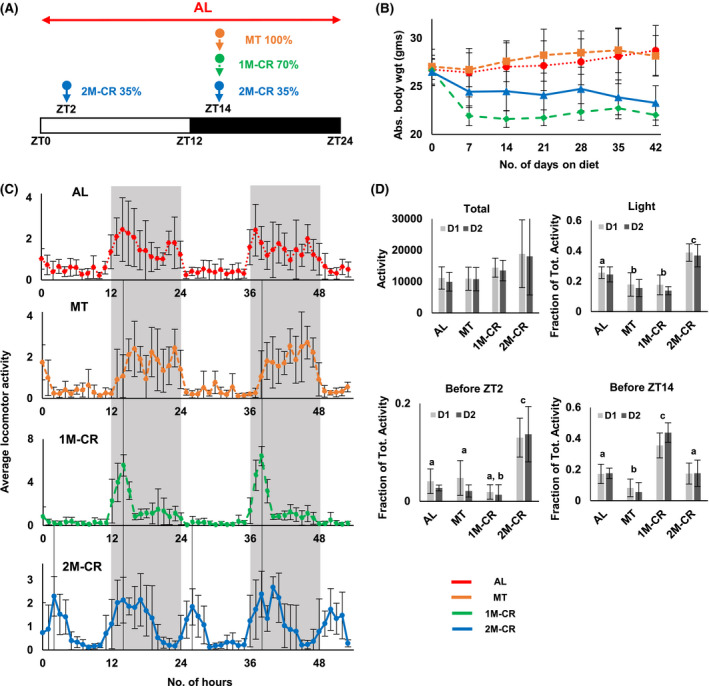
FIGURE 1.

Effect of different diets on mouse daily rhythms in locomotor activity. A, Design of the experiment. B, Body weight of mice on different diets: AL––dotted red line, N = 13; MT––small‐dashed brown line, N = 6; 1M‐CR––large‐dashed green line, N = 6; and 2M‐CR––solid blue line, N = 22. C, Average in‐cage locomotor activity for mice on indicated diets. The activity was recorded for two random days. The activity for each mouse was normalized to average hourly activity, after that average activity and standard deviations were calculated for mice on every diet. Black line indicted the time when the food was provided to mice. D, In‐cage activity on Day 1 (light gray) and Day 2 (dark gray): total activity––upper left panel; the activity during the light phase of the day, shown as a fraction of total daily activity, which was set up as 1.0––upper right panel; the activity in 2 hours before ZT2, data are shown as a fraction of total daily activity, which was set up as 1.0––lower left panel; and the activity in 2 hours before ZT14, data are shown as a fraction of total daily activity, which was set up as 1.0––lower right panel. N = 6 per diet, Bars with different letters are significantly different from each other. The light was on at ZT0 and off at ZT12. Gray panels indicate dark phase of the day
