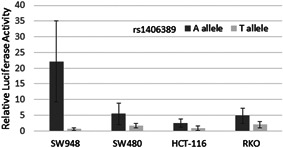
Figure 2.

Allele‐specific enhancer activity. Enhancer depicted as region 4 in Figure 1 was cloned into a luciferase enhancer assay construct including SNP rs1406389 alleles A and T. The construct with the A allele demonstrated statistically significantly higher activity than the T allele (p values for SW948 = 5.77 × 10⁻⁶, SW480 = 1.12 × 10⁻³, HCT116 = 3.20 × 10⁻⁴, RKO = 1.58 × 10⁻⁶ were calculated using the two‐sided Student's t test). SNP, single nucleotide polymorphism
