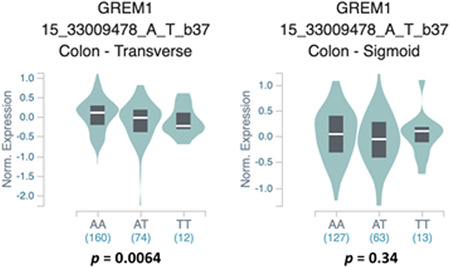
Figure 4.

Violin plots showing the correlation between normalized GREM1 gene expression and rs1406389 genotype. The T allele was significantly correlated with reduced GREM1 expression in transverse colon but not sigmoid colon. Data were generated using the Single‐Tissue eQTLs function in the GTEx Data Portal. eQTL, expression quantitative trait loci; GTEx, Genotype‐Tissue Expression
