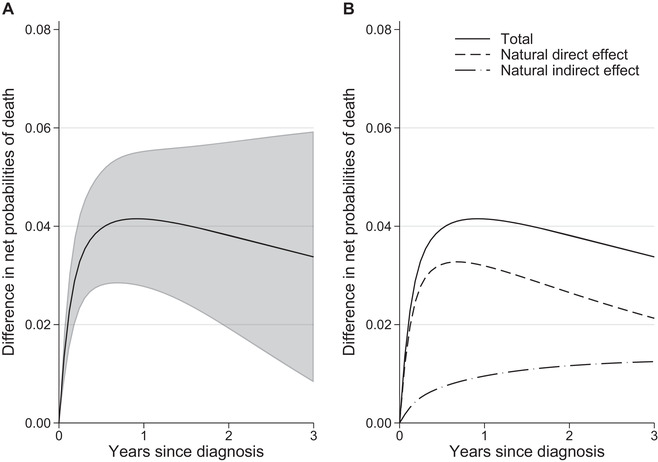
FIGURE 3.

(A) Total causal effect, defined as the difference in standardized net probabilities of death, with 95% confidence intervals and (B) partitioning of the total causal effect to the natural direct and indirect effect due to stage at diagnosis
