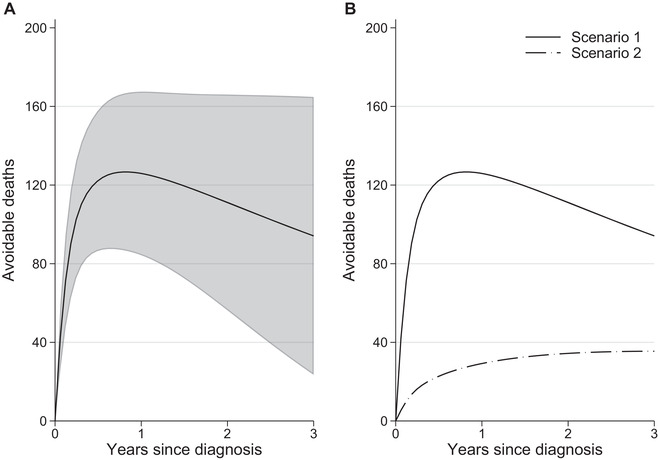
FIGURE 5.

(A) Total avoidable deaths by removing relative survival and stage differences between the least and most deprived groups (Scenario 1) with 95% confidence intervals and (B) partitioning total avoidable deaths to those under an intervention of “eliminating differences in the stage at diagnosis distribution” (Scenario 2)
