
FIGURE 4.
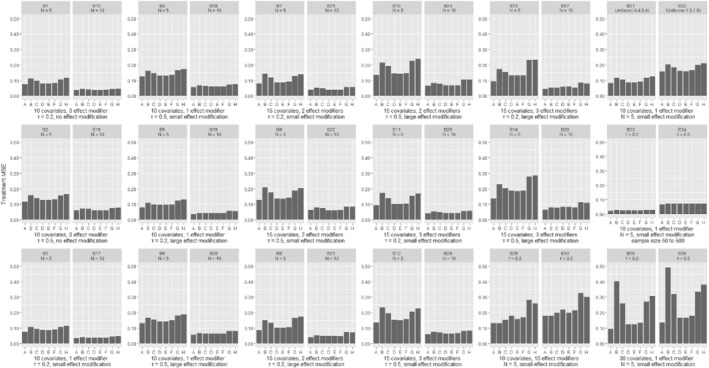
Results from simulations of a binary outcome, comparing different methods in terms of the average treatment effect mean square error. Scenarios (B1‐B28) are shown in pairs, differing only in the number of studies. Within each pair, the two scenarios explore the same type of outcome, have the same number of covariates and effect modifiers, equal heterogeneity and magnitude of effect modification. Scenarios B29‐B36 are shown in pairs, differing only in the assumed heterogeneity (τ). Scenarios are described in detail in Section 2 of the Appendix. A, GLMM‐oracle; B, GLMM‐full; C, STEP; D, LASSO; E, ridge; F, Adaptive LASSO; G, Bayesian LASSO; H, SSVS