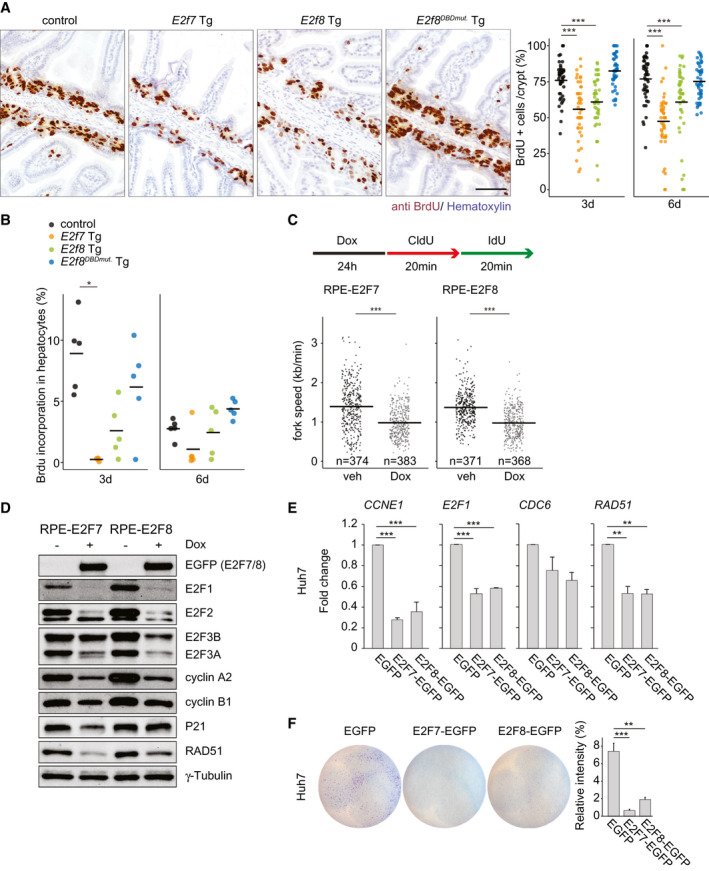
Fig. 2.

E2F7 and E2F8 expression inhibits ongoing DNA replication. (A) Immunohistochemistry using anti‐BrdU to label S‐phase cells in small intestines of Tg mice treated for 6 days with doxycycline. Scale bar, 50 μm. Dot plot shows quantification of BrdU‐positive area in five fields using the ×20 objective. Crossbars represent averages per genotype (n = 45 crypts/genotype, n = 3 mice/genotype). (B) Dot plot shows the percentage of BrdU‐positive hepatocyte nuclei per condition. Crossbars represent average values per condition (n = 5 mice). E2f7 Tg after 3‐day doxycycline (n = 4). (C) Experimental work flow and quantification of replication fork speed in the cell lines and conditions indicated. Data from two separate experiments are pooled. Only ongoing replication forks (red+green) were included in the quantification. Crossbars represent average values per condition. (D) Protein expression of cell cycle regulators in the indicated RPE inducible cell lines after 24 hours of doxycycline treatment. (E) Transcript levels of CDC6, E2F1, and RAD51 in Huh7 cells. EGFP‐positive cells were sorted 24 hours after transfections and directly collected for RNA analysis. Fold changes were adjusted to average of EGFP controls and GAPDH and RSP18 were used to normalize the expression. Data represent average ± SEM of at least two different experiments. (F) Clonogenic survival assay of EGFP FACS‐sorted Huh7 cells. Cells were transfected with the indicated plasmids for 24 hours before FACS‐sorting and replated for 72 hours. Histogram shows the quantification of relative intensity from each condition. Data represent average ± SEM (two independent experiments were performed in at least duplicate). Data information: In (A,B,E,F), *P < 0.05, **P < 0.01, ***P < 0.001 (Kruskal‐Wallis one‐way analysis of variance on ranks and Dunnett’s method for multiple comparisons versus control). In (C) ***P < 0.001 (Mann‐Whitney rank sum test). Abbreviations: CCNE1, cyclin E1; CldU, chlorodeoxyuridine; IdU, iododeoxyuridine; Dox, doxycycline; veh, vehicle.
