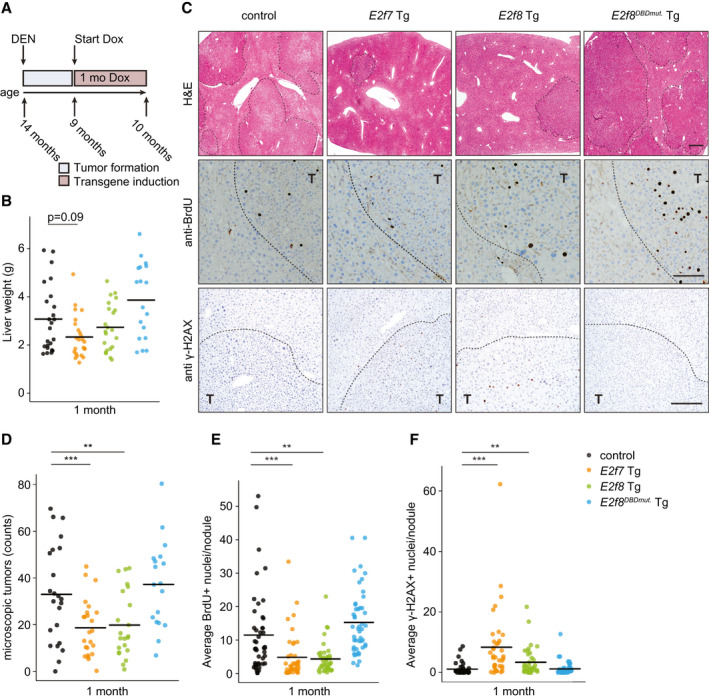
Fig. 4.

Proliferation of DEN‐induced liver tumors is inhibited by induction of transgenic E2F7 expression. (A) Schematic overview of the tumor experiment. (B) Gross liver weights after 1 month of doxycycline treatment. Crossbars indicate the average per genotype (control n = 24, E2f7 Tg n = 24, E2f8 Tg n = 22, E2f8DBDmut. Tg n = 18 mice). (C) Representative pictures of hematoxylin and eosin–stained (top), BrdU‐stained (middle), and γ‐H2AX‐stained (bottom) liver sections after 1 month of doxycycline treatment. Liver tumors are outlined with dashed lines. Scale bars, 500 μm (top), 100 μm (middle), and 50 μm (bottom). (D) Dot plot showing the numbers of microscopic liver tumors detected in hematoxylin and eosin–stained sections per mouse after 1 month of doxycycline. Crossbars represent average per genotype (control n = 23, E2f7 Tg n = 24, E2f8 Tg n = 22, E2f8DBDmut. Tg n = 18 mice). (E) Quantification of BrdU immunohistochemically stained liver sections from (C). Each dot represents the average of BrdU‐positive hepatocytes, counted in five fields (×40 objective), per nodule. At least three random tumor nodules were analyzed per mouse, n = 10 mice/genotype) (control n = 46, E2f7 Tg n = 40, E2f8 Tg n = 42, E2f8DBDmut. Tg n = 47 nodules). (F) Average number of γ‐H2AX‐positive hepatocyte nuclei per field (five fields, ×40 objective) per tumor nodule. At least three random tumor nodules were analyzed per animal, n = 10 mice/genotype. Crossbars represent average values per genotype (control n = 41, E2f7 Tg n = 38, E2f8 Tg n = 38, E2f8DBDmut. Tg n = 50 nodules). Data information: In (B,D‐F), *P < 0.05, **P < 0.01, ***P < 0.001 (Kruskal‐Wallis one‐way analysis of variance on ranks and Dunnett’s method for multiple comparisons versus control). Abbreviations: Dox, doxycycline; H&E, hematoxylin and eosin; T, tumor.
