
Figure 2.
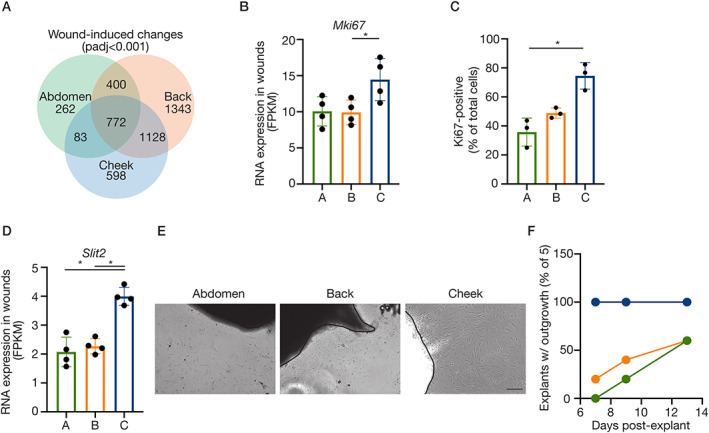
Distinct wound responses across anatomical sites. (A) Venn diagram illustrating wound‐induced gene expression changes by site (cut‐off: padj < 0.001, paired, two‐tailed, non‐parametric t‐tests). (B) RNA expression (FPKM) of Mki67. (C) Ki67 immunostaining in primary fibroblasts (passage 0) from different anatomical sites. Individual points represent mean Ki67‐positive nuclei (counted in >2 fields of view per cell line) as a percentage of total nuclei (DAPI‐stained), three (paired, i.e. mouse‐matched) independent cell isolations are plotted (*p < 0.05, non‐parametric Friedman test with Dunn's multiple comparison). (D) RNA expression (FPKM) of Slit2. (E) Phase‐contrast images of cellular outgrowth from dermis explants (day 9). Scale: 100 μm. (F) Time‐course of fibroblast outgrowth from dermis explants, plotting percentage of explants with visible emigrating cells. (B,D) Plotted points are skin/wound isolations from four mice per anatomical site. Bars/error bars = mean ± SD. Abbreviations and colour‐coding: A, abdomen (lateral plate mesoderm‐derived; green); B, back (paraxial mesoderm‐derived; orange); C, cheek (craniofacial, neural crest‐derived; blue).