Figure 3.

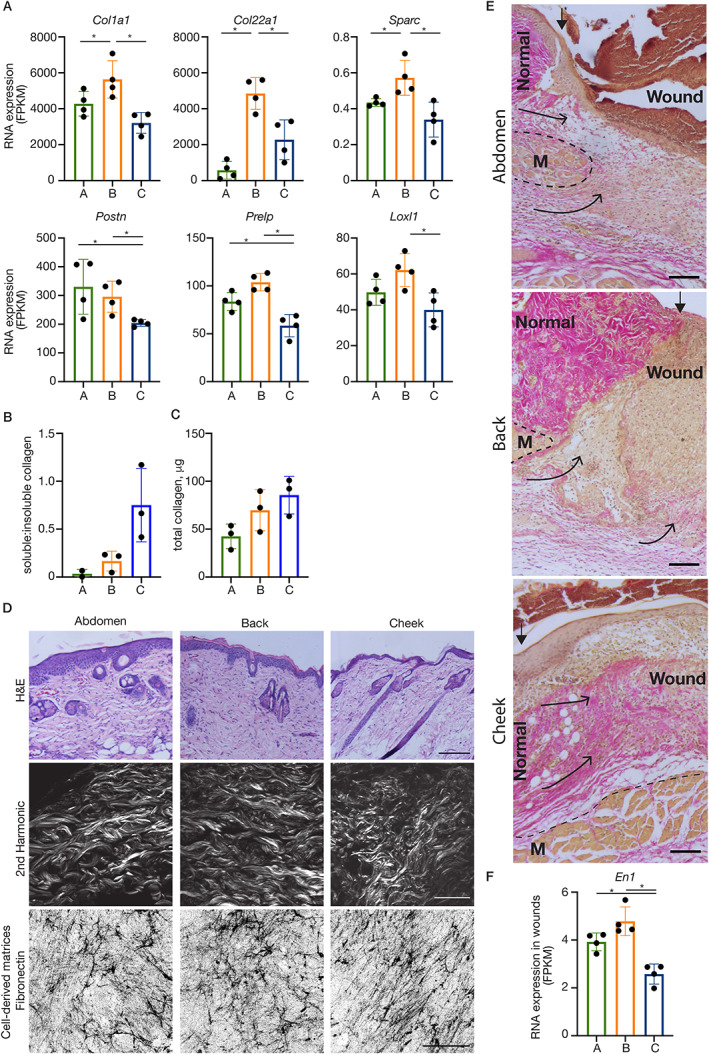
Anatomical variations in dermal ECM. (A) RNA expression (FPKM) of differentially expressed ECM genes with back‐ (top row) and cheek‐ (bottom row) specific expression patterns. Plotted points are skin/wound isolations from four mice per anatomical site. *padj < 0.05. (B) The ratio of soluble:insoluble collagen and (C) total collagen determined using Sircol assays on 4 mm biopsy punches of skin from different anatomical sites. Plotted points represent paired (i.e. mouse‐matched) independent skin isolations from two or three mice. (D) Histological analyses (H&E, top row) and second harmonic generation imaging (middle row) of dermis illustrate site‐specific characteristics (e.g. bundle thickness, density, orientation) of the collagenous ECM. Scale (H&E): 200 μm; (second harmonic): 50 μm. (Bottom row) Representative examples of maximum projection confocal images of cell‐derived matrices (immunostained for fibronectin) from fibroblasts established from dermis of different anatomical sites. Scale: 50 μm. (E) HVG histology illustrates differing tissue responses to damage, particularly the contribution of collagenous matrix (bright pink with HVG stain) from the fascia deep to the panniculus carnosus muscle (M). Scale bars: 100 μm. Arrowheads (filled): watershed between normal dermis and the wound bed; arrows (open heads) illustrate the contribution of tissue layers to the wound bed. (F). RNA expression (FPKM) of Engrailed (En)‐1. Bars/error bars = mean ± SD. Abbreviations and colour‐coding: A, abdomen (lateral plate mesoderm‐derived; green); B, back (paraxial mesoderm‐derived; orange); C, cheek (craniofacial, neural crest‐derived; blue).
