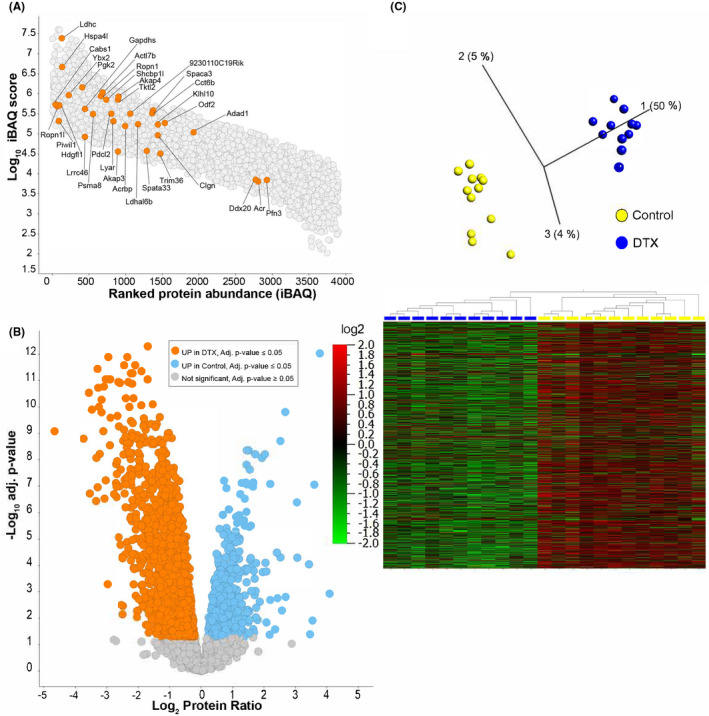
FIGURE 1.

Impact of DTX‐treatment on the mouse TIF proteome. A, iBAQ analysis and dynamic range estimation of all quantified proteins in TIF from normal mice with intact spermatogenesis. iBAQ expression values for the proteins quantified are plotted with the log10 iBAQ intensity on the y axis and proteins are ranked by iBAQ intensity on the x axis. Highlighted proteins are those that are expressed specifically in adluminal germ cells in sperm in both mice and humans (see Table 1). B, Volcano plot illustrating the log2 protein ratios in mice with Sertoli cell ablation (DTX mice) relative to control mice. Significant differentially regulated proteins are colored in orange (UP in DTX treatment) or blue (UP in control mice) (adjusted P value ≤ .05). C, Principle Component Analysis (PCA, top) and heat map (bottom) of the n = 1812 proteins that were significantly different between control (yellow) and DTX (blue) TIF samples. The PCA plot reveals a clear separation between the control and DTX‐treated mice. Heat map data are log2 protein ratio in DTX mice relative to control
