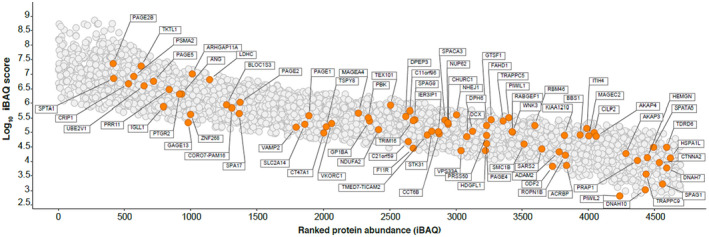
FIGURE 2.

The human TIF proteome. iBAQ analysis and dynamic range estimation of n = 4720 proteins identified in human TIF. iBAQ expression values for the proteins quantified are plotted with the log10 iBAQ intensity on the y axis and proteins are ranked by iBAQ intensity on the x axis. Proteins that have been identified as cancer‐testis antigens (CTAs) are highlighted in orange (see Supplemental Dataset 8)
