
FIGURE 4.
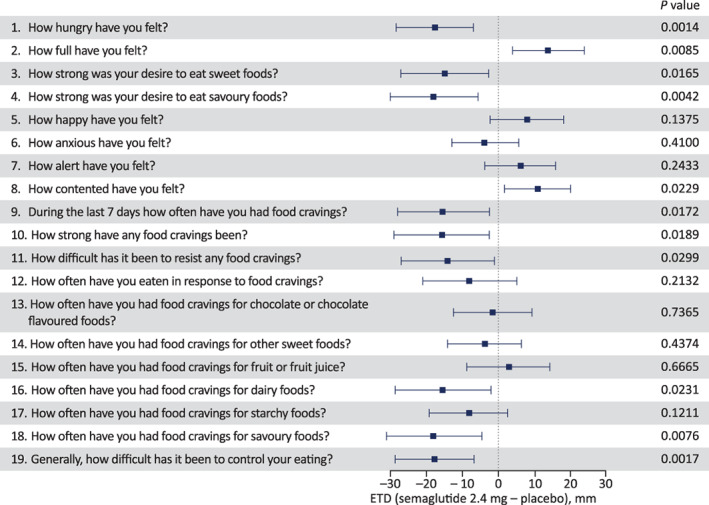
Control of eating and food cravings evaluated by the Control of Eating Questionnaire visual analogue scale at week 20. The Control of Eating Questionnaire was completed by participants at the end of the 20‐week treatment period (day 141), based on their experience over the prior 7 days. Individual scores for each question were analysed using separate analysis of covariance models with change from baseline as response, baseline value of respective question as a covariate and treatment as factor (post hoc analysis methodology). The figure shows the estimated treatment difference (ETD) for semaglutide versus placebo (boxes) and 95% confidence interval (whiskers)