

Abstract
Several non‐hydrolytic sol–gel syntheses involving different precursors, oxygen donors, and conditions have been screened aiming to selectively produce mesoporous t‐ZrO2 or m‐ZrO2 with significant specific surface areas. The in situ water formation was systematically investigated by Karl Fisher titration of the syneresis liquids. XRD and nitrogen physisorption were employed to characterize the structure and texture of the ZrO2 samples. Significant amounts of water were found in several cases, notably in the reactions of Zr(OnPr)4 with ketones (acetone, 2‐pentanone, acetophenone), and of ZrCl4 with alcohols (benzyl alcohol, ethanol) or acetone. Conversely, the reactions of Zr(OnPr)4 with acetic anhydride or benzyl alcohol at moderate temperature (200 °C) and of ZrCl4 with diisopropyl ether appear strictly non‐hydrolytic. Although reaction time and reaction temperature were also important parameters, the presence of water played a crucial role on the structure of the final zirconia: t‐ZrO2 is favored in strictly non‐hydrolytic routes, while m‐ZrO2 is favored in the presence of significant amounts of water. 1H and 13C NMR analysis of the syneresis liquids allowed us to identify the main reactions responsible for the formation of water and of the oxide network. The morphology of the most interesting ZrO2 samples was further investigated by electron microscopy (SEM, TEM).
Keywords: catalyst support, mesoporous materials, nonhydrolytic sol–gel, sol–gel processes, zirconia
Water in non‐hydrolytic sol–gel: Monitoring in situ water formation in non‐hydrolytic sol–gel routes to mesoporous zirconia shows that it impacts not only the mechanism of the sol–gel process but also the structure of the final material.

Introduction
Mesoporous oxides are of primary importance in the areas of heterogeneous catalysis, adsorption, separation or energy. Non‐hydrolytic sol–gel (NHSG) or non‐aqueous sol–gel provides simple, cost‐effective routes for the synthesis of non‐ordered mesoporous metal oxides or mixed oxides, avoiding the use of reactivity modifiers, templates or supercritical drying.[ 1 , 2 ] NHSG is performed in non‐aqueous medium and the oxygen of the oxide network is not provided by added water but by organic compounds (e.g. ethers, alcohols, ketones, etc.).[ 1 , 3 , 4 , 5 , 6 , 7 ] Importantly, NHSG involves organic reaction pathways, and the moderate reactivity of C−O bonds results in easily manageable reaction rates, facilitating the control of the structure and texture. Even if the starting reaction mixture is anhydrous, water may be produced in situ by organic reactions, such as alcohol dehydration, esterification, or aldol condensation. In addition, hydroxyl (M−OH) groups resulting from non‐hydrolytic hydroxylation reactions [3] can condense together with formation of water. Accordingly, only a few routes involving only aprotic reactions are strictly non‐hydrolytic or non‐aqueous.[ 3 , 7 ] The presence of water in the reaction medium can impact not only the mechanism of formation of the oxo bridges, but also the structure, surface chemistry, morphology or texture of the final nanomaterials.[ 5 , 7 , 8 ] However, there have been very few attempts at quantifying the water in NHSG reactions, and studies comparing water formation in different NHSG routes for a given oxide are lacking.
In this work we investigated the formation of water and its influence on the structure of the final oxide for nine different NHSG routes, involving two precursors and seven O‐donors. As a case study, we chose the synthesis of mesoporous ZrO2.
Indeed, ZrO2 is an important catalytic material owing to its high thermal stability, the presence of both acid and basic sites and its oxidizing and reducing properties.[ 9 , 10 , 11 , 12 , 13 ] Moreover, the surface properties, activity and selectivity of zirconia‐based catalysts depend on the structure of the ZrO2 phase.[ 12 , 13 , 14 , 15 , 16 ] At atmospheric pressure, three polymorphs are known for bulk ZrO2: the monoclinic phase (m‐ZrO2) is stable up to 1170 °C, the tetragonal phase (t‐ZrO2) is stable between 1170 °C and 2370 °C, and the cubic phase (c‐ZrO2) above 2370 °C. However, the tetragonal and cubic phases can be stabilized at room temperature up to a critical crystallite size of about 30 nm because their surface energy is lower than that of the monoclinic phase. [17] The presence of lattice strain, [18] impurities[ 19 , 20 ] or oxygen vacancies [21] also stabilizes the tetragonal phase. Accordingly, the synthesis in aqueous medium by conventional sol–gel/precipitation methods of high‐surface area zirconia with controlled phase has attracted much attention.[ 10 , 15 , 22 , 23 , 24 ] Conversely, the synthesis of mesoporous ZrO2 by NHSG routes remains practically unexplored. Jansen and Guenther obtained after calcination at 500 °C tetragonal zirconia by ester elimination between Zr(OAc)4 and Zr(OnPr)4, [25] but the specific surface area was not reported. Warwar Damouny et al. reported that the reaction of ZrCl4 with iPr2O (ether route) led after calcination at 800 °C to a mixture of t‐ZrO2 and m‐ZrO2 phases with a low specific surface area (16 m2 g−1). [26] On the other hand, the synthesis of ZrO2 nanoparticles by two NHSG routes has been investigated. Although the particles were not calcined in order to avoid aggregation, crystalline particles were obtained owing to the high reaction temperatures used (200–340 °C). The alkoxide route involving the reaction of ZrCl4 with Zr(OiPr)4⋅iPrOH in the presence of a capping agent was used initially, leading to c‐ZrO2 or t‐ZrO2 particles.[ 27 , 28 ] The most used route is the surfactant‐free benzyl alcohol route, based on the reaction of zirconium alkoxides[ 29 , 30 , 31 , 32 , 33 , 34 ] or zirconium chloride[ 33 , 35 ] in benzyl alcohol at 200–270 °C in an autoclave. Due to the large number of parameters that influence the crystallinity (precursor, concentration, reaction temperature, time, liner material),[ 31 , 32 ] the control of the structure by the benzyl alcohol route is not straightforward. Interestingly, two articles discuss the possible role of water. De Keukeleere et al. proposed that the formation of m‐ZrO2 nanoparticles in the reaction of benzyl alcohol with ZrCl4 was due to the release of HCl, which catalyzed the formation of water by dehydration of benzyl alcohol. In the reaction of Zr(OiPr)4⋅iPrOH with benzyl alcohol, they found that addition of water alone was not sufficient to promote the formation of m‐ZrO2 instead of c‐ZrO2 and that the addition of a strong acid was necessary. [33] In a recent study Gambe et al. reported that water formed also in the reaction of Zr(OiPr)4⋅iPrOH in benzyl alcohol, presumably by intramolecular dehydration of iPrOH, leading to tetragonal‐monoclinic mixtures. [34]
The aim of the present article is to thoroughly investigate the synthesis by different NHSG routes of mesoporous ZrO2 supports, with controlled tetragonal or monoclinic structure, and to clarify the role of water, that is, to see if water is produced in other NHSG routes and if it governs the crystal structure.
In the first part of this work, several different non‐hydrolytic routes and reaction conditions (temperature, time) were screened and the water content in the reaction medium was systematically measured by Karl Fisher titration. The texture and the crystalline structure of the different samples was investigated, aiming to identify conditions leading selectively to mesoporous t‐ZrO2 or m‐ZrO2 supports with significant specific surface area.
In the second part, the main parameters governing the final crystalline phase were identified and the major role of water was confirmed based on the data collected in the screening study.
In the third part, NMR analysis of the syneresis liquids was used to identify for the different NHSG routes the main reactions responsible for the formation of water and of the oxide network.
In the last part, the texture and morphology of selected ZrO2 samples was investigated.
Results and Discussion
Part 1: Screening study
In order to find the conditions suitable for selectively obtaining after calcination mesoporous t‐ZrO2 or m‐ZrO2 and to establish the presence or absence of water in different NHSG routes, we synthesized a range of ZrO2 samples by several non‐hydrolytic sol–gel routes at various reaction temperatures and times, using two precursors, Zr(OnPr)4 (ZNP) and ZrCl4 (ZCL), and seven O‐donors, diisopropyl ether (DIPE), ethanol (EtOH), benzyl alcohol (BnOH), acetic anhydride (Ac2O), acetophenone (AcPh), 2‐pentanone (MPK) and acetone (ACE). In the non‐hydrolytic sol–gel literature, O‐donors such as ethers or acetic anhydride are used in a stoichiometric amount or in slight excess, while alcohols or ketones are usually used as both O‐donor and solvent. In this work, we followed the same approach. For all of the syntheses, the amounts of precursor, O‐donor and solvent (if any), the reaction temperature and reaction time are summarized in Table 1. In the following, the oxide samples (after calcination) are named after the precursor, the O‐donor, the reaction temperature, and the reaction time as shown in Table 1. For example the ZrO2 sample ZNP‐AcPh 200/12 was prepared from Zr(OnPr)4 precursor by the acetophenone route at 200 °C for 12 h. The xerogel samples (before calcination) are indicated by the suffix “‐X”, as in ZNP‐AcPh 200/12‐X.
Table 1.
Reaction conditions for the synthesis of zirconia samples from Zr(OnPr)4 and ZrCl4 precursors.
|
Sample name |
Precursor |
O‐donor |
Solvent |
Conditions |
|---|---|---|---|---|
|
ZNP‐Ac2O 200/12 ZNP‐Ac2O 200/72 ZNP‐Ac2O 200/168 ZNP‐Ac2O 240/72 ZNP‐Ac2O 270/72 |
Zr(OnPr)4 5.3 mmol |
Acetic anhydride 1.00 mL, 10.6 mmol |
Toluene, 10 mL |
200 °C, 12 h 200 °C, 72 h 200 °C, 168 h 240 °C, 72 h 270 °C, 72 h |
|
|
|
|
|
|
|
ZNP‐BnOH 200/24 ZNP‐BnOH 200/168 ZNP‐BnOH 240/24 |
Zr(OnPr)4 5.3 mmol |
Benzyl alcohol 10.0 mL, 96 mmol |
O‐donor |
200 °C, 24 h 200 °C, 168 h 240 °C, 24 h |
|
|
|
|
|
|
|
ZNP‐AcPh 200/12 ZNP‐AcPh 240/18 |
Zr(OnPr)4 5.3 mmol |
Acetophenone 10.0 mL, 85.4 mmol |
O‐donor |
200 °C, 12 h 240 °C, 18 h |
|
|
|
|
|
|
|
ZNP‐MPK 200/12 ZNP‐MPK 200/72 ZNP‐MPK 200/168 ZNP‐MPK 240/18 ZNP‐MPK 240/72 |
Zr(OnPr)4 5.3 mmol |
2‐pentanone 10.0 mL, 94 mmol |
O‐donor |
200 °C, 12 h 200 °C, 72 h 200 °C, 168 h 240 °C, 18 h 240 °C, 72 h |
|
|
|
|
|
|
|
ZNP‐ACE 200/12 ZNP‐ACE 240/72 |
Zr(OnPr)4 5.3 mmol |
Acetone 10.0 mL, 135 mmol |
O‐donor |
200 °C, 12 h 240 °C, 72 h |
|
|
|
|
|
|
|
ZCL‐DIPE 110/72 ZCL‐DIPE 180/72 |
ZrCl4 8.0 mmol |
Diisopropylether 17.6 mmol |
CH2Cl2, 10 mL |
110 °C, 72 h 180 °C, 72 h |
|
|
|
|
|
|
|
ZCL‐EtOH 110/72 ZCL‐EtOH 150/72 |
ZrCl4 8.0 mmol |
Ethanol, 6.0 mL, 103 mmol |
O‐donor |
110 °C, 72 h 150 °C, 72 h |
|
|
|
|
|
|
|
ZCL‐BnOH 110/12 ZCL‐BnOH 180/12 |
ZrCl4 8.0 mmol |
Benzyl alcohol 6.7 mL, 64 mmol |
O‐donor |
110 °C, 12 h 180 °C, 12 h |
|
|
|
|
|
|
|
ZCL‐ACE 200/18 ZCL‐ACE 240/72 |
ZrCl4 8.0 mmol |
Acetone 10 mL, 135 mmol |
O‐donor |
200 °C, 18 h 240 °C, 72 h |
We chose Zr(OnPr)4 rather than Zr(OiPr)4 because of its higher thermal stability: Inoue et al. reported that the solvothermal decomposition of Zr(OiPr)4 at 265 °C for 2 h gave amorphous zirconia whereas no reaction was observed at 300 °C with Zr(OnPr)4. [56] Zr(OnPr)4 is commercially available as a 70 wt % solution in 1‐propanol (nPrOH). However, nPrOH is a potential O‐donor and it can react with itself or other alcohols (dehydration), with Ac2O (esterification), or with ketones (ketalization). To avoid such secondary reactions, nPrOH was removed before use by treatment for 15 h under primary vacuum at 120 °C (Figure S1, Supporting Information).
To investigate the possible role of water, we used Karl Fischer titration to systematically quantify the water present in the liquid phase after reaction. The structure and texture of both the xerogels (non‐calcined dried gels) and the final ZrO2 samples were characterized by powder X‐ray diffraction and nitrogen physisorption. The results are summarized in Table 2, and XRD patterns of selected samples are reported in Figures 1 and 2.
Table 2.
Crystalline phases and specific surface area of the non‐hydrolytic zirconia samples, before and after calcination, and water content in the liquid phase after reaction.
|
Sample name |
% t[a] (vol %) |
S BET [b] (m2 g−1) |
H2O |
|||
|---|---|---|---|---|---|---|
|
|
xerogel |
calcined |
xerogel |
calcined |
ppm[c] |
H2O:Zr[d] |
|
ZNP‐Ac2O 200/12 ZNP‐Ac2O 200/72 ZNP‐Ac2O 200/168 ZNP‐Ac2O 240/72 ZNP‐Ac2O 270/72 |
Am.[e] Am. Am. 20 20 |
100 100 100 15 10 |
500 250 / 310 445 |
<5 <5 <5 80 95 |
<10 <10 <10 890 940 |
0.00 0.00 0.00 0.10 0.11 |
|
|
|
|
|
|
|
|
|
ZNP‐BnOH 200/24 ZNP‐BnOH 200/168 ZNP‐BnOH 240/24 |
35 5 70 |
45 5 75 |
<5 <5 45 |
20 5 55 |
40 70 1160 |
0.00 0.01 0.14 |
|
|
|
|
|
|
|
|
|
ZNP‐ACE 200/12 ZNP‐ACE 240/72 |
40 15 |
45 5 |
470 230 |
55 85 |
9460 18700 |
0.91 1.75 |
|
|
|
|
|
|
|
|
|
ZNP‐AcPh 200/12 ZNP‐AcPh 240/18 |
Am. 15 |
95 15 |
105 210 |
40 95 |
450 9460 |
0.06 1.13 |
|
|
|
|
|
|
|
|
|
ZNP‐MPK 200/12 ZNP‐MPK 200/72 ZNP‐MPK 200/168 ZNP‐MPK 240/18 ZNP‐MPK 240/72 |
Am. 70 20 25 20 |
90 65 15 20 15 |
225 375 275 260 235 |
80 80 110 95 115 |
410 2860 6430 7670 15400 |
0.04 0.28 0.62 0.74 1.48 |
|
|
|
|
|
|
|
|
|
ZCL‐DIPE 110/72 ZCL‐DIPE 180/72 |
Am. 100 |
100 100 |
20 <5 |
95 10 |
<10 <10 |
0.00 0.00 |
|
|
|
|
|
|
|
|
|
ZCL‐EtOH 110/72 ZCL‐EtOH 150/72 |
Am. 5 |
85 5 |
/ 160 |
40 130 |
3500 11500 |
0.14 0.45 |
|
|
|
|
|
|
|
|
|
ZCL‐BnOH 110/12 ZCL‐BnOH 180/12 |
Am. 15 |
85 5 |
/ 100 |
130 80 |
610[f] H2O phase |
0.30 / |
|
|
|
|
|
|
|
|
|
ZCL‐ACE 200/18 ZCL‐ACE 240/72 |
5 0 |
0 0 |
100 / |
105 70 |
H2O phase H2O phase |
/ / |
[a] Volume percentage of t‐ZrO2 phase, values rounded to the nearest 5 % (% m = 100−% t). [b] Specific surface area obtained by the BET method. [c] From Karl Fischer titration of the liquid phase. [d] Water to Zr molar ratio calculated from the water content and the amounts of reactants, assuming complete condensation and assuming that all the water and organic byproducts are in the liquid phase. [e] Amorphous. [f] No syneresis liquid, the gel was crushed under argon in 6.0 mL anhydrous EtOH and the ethanolic solution was analyzed.
Figure 1.

Reference XRD patterns for monoclinic, tetragonal, and cubic zirconia polymorphs (a), and powder XRD patterns of selected samples prepared from Zr(OnPr)4, before (black) and after calcination (red) (b–f).
Figure 2.

Powder XRD patterns of selected ZrO2 samples prepared from ZrCl4, before (black) and after calcination (red) (a–d).
Formation of water during the reaction
Depending on the NHSG route and the reaction conditions, the water content in the syneresis liquids ranged from less than 10 ppm to nearly 20 000 ppm (i.e. 2 wt %). In addition, separation of an aqueous phase was observed for the last 3 samples of Table 2 (note that in these cases nearly all the acetone or benzyl alcohol was consumed during the reactions, as shown in Part 3). Actually, among all the reactions tested, only a few can be considered as strictly non‐hydrolytic or non‐aqueous: the reaction of ZrCl4 with DIPE at 110 or 180 °C, of Zr(OnPr)4 with Ac2O at 200 °C, and of Zr(OnPr)4 in BnOH at 200 °C. Conversely, the reaction of ZrCl4 in EtOH, BnOH or acetone and the reactions of Zr(OnPr)4 in the different ketones at 240 °C all led to rather high water content, between 3500 and 19 000 ppm. In these cases, the H2O:Zr ratio in the syneresis liquid after reaction ranges from 0.20 to 1.75 (Table 2), which is far from negligible, especially considering that this is the amount of water present after reaction, and that hydrolysis/condensation reactions could have consumed a significant amount of water (up to 2 moles per mole of Zr precursor for a completely hydrolytic pathway).
Structure of ZrO2 samples
The peaks found in the XRD patterns (Figures 1 and 2) of the crystalline samples can be ascribed either to the tetragonal phase, t‐ZrO2 (space group P42/nmc, ICSD 00‐050‐1089) (peaks at 2θ 30.3°, 34.8°, 35.3°, 50.4, 59.6°, 60.2°) or to the monoclinic phase m‐ZrO2 (space group P21/a, ICSD 00‐037‐1484) (peaks at 2θ 24.0°, 24.4°, 28.2°, 31.5°, 34.2°, 34.4°, 35.3°). The t‐ZrO2 phase is very close to the cubic phase, c‐ZrO2 (space group Fm m, ICSD 00‐049‐1642) and in some case line broadening can make the assignment difficult. However, the asymmetry of the kα1 peaks at 2θ=35°and 60°, due to the characteristic splittings of the tetragonal phase, supports a tetragonal structure. [36] The volume percentage of tetragonal phase, % t, was derived from the intensities of the (101) peak of t‐ZrO2 at 30.3° and of the (−111) and (111) peaks of m‐ZrO2 at 28.2 and 31.5°, respectively. [37]
The data reported in Table 2 show that for both precursors, ZrCl4 and Zr(OnPr)4, several sets of reaction conditions (O‐donor, reaction temperature and time) lead after calcination to practically pure t‐ZrO2 (% t ≥ 95) (e.g. ZNP‐Ac2O 200/72, ZNP‐AcPh 200/12, ZCL‐DIPE 110/72, ZCL‐BnOH 110/12) or practically pure m‐ZrO2 (% t ≤ 5) (e.g. ZNP‐ACE 240/72, ZCL‐EtOH 150/72, ZCL‐BnOH 180/12, ZCL‐ACE 200/18, ZNP‐BnOH 200/168).
Comparison of the diffractograms of the different samples before and after calcination (Figures 1 and 2) shows that under our conditions (5 h at 500 °C in air) calcination has a significant impact only for the amorphous samples (e.g. ZNP‐Ac2O 200/72, ZNP‐MPK 200/12, ZNP‐AcPh 200/12, ZCL‐DIPE 110/72, ZCL‐EtOH 110/72, ZCL‐BnOH 110/12), which are converted upon calcination to predominantly tetragonal samples. Calcination of crystalline xerogels only leads to a moderate change (<10 %) of the percentages of tetragonal and monoclinic phases.
Texture of ZrO2 samples
Before calcination, the specific surface areas (S BET) range between 0 and 500 m2 g−1, and after calcination, between 0 and 130 m2 g−1. There is no correlation between the water content in the reaction medium and SBET of the xerogels. In most cases calcination leads to a significant decrease of S BET. This decrease can be due to crystallite growth, resulting in a lower geometrical surface area of the particles, and to the sintering of the particles. Significant particle growth upon calcination occurs for instance in ZNP‐Ac2O 270/72, ZNP‐ACE 240/72 or ZCL‐BnOH 180/12, as shown by the narrowing of XRD peaks upon calcination (Figures 1 and 2). Conversely, the removal of organic residues by the calcination should lead to an increase in the specific surface area, as organics are usually non porous and may partially block the pores. Due to these conflicting effects, predicting the effect of calcination on specific surface areas is not possible.
Note that the calcination step was not optimized in view of obtaining very high surface areas. In all cases the samples were calcined at 500 °C for 5 h (heating rate 10 °C min−1). A lower calcination temperature and/or a shorter calcination time could lead to significantly higher surface areas. For instance, we found that calcination at 500 °C for 1 h instead of 5 h of ZNP‐Ac2O 240/72 and ZCL‐BnOH 180/12 led to nearly twice higher specific surface areas and higher pore volumes, while a low heating rate (1 °C min−1 instead of 10 °C min−1) had nearly no influence (Table S1 and Figure S2).
Even after calcination at 500 °C for 5 h, several syntheses led to nearly pure m‐ZrO2 or t‐ZrO2 with high specific surface area. With the Zr(OnPr)4 precursor, reaction with ketones appear particularly interesting, thus reaction with MPK at 200 °C for 12 h mainly leads to t‐ZrO2 (%t = 90 % ) with a S BET of 80 m2 g−1 while reaction with ACE at 240 °C for 72 h affords nearly pure m‐ZrO2 (%t = 5 %) with a S BET of 85 m2 g−1. In the case of the ZrCl4 precursor, reaction with DIPE at 110 °C for 72 h leads to pure t‐ZrO2 with a S BET of 95 m2 g−1 while reaction in EtOH at 150 °C for 72 h leads to m‐ZrO2 (%t = 5 %) with a S BET of 130 m2 g−1 (samples highlighted in bold in Table 2). The texture and morphology of these samples are presented in part 3.4.
Part 2: Control of the crystalline phase
In several cases, we could control the crystalline phase of the calcined samples and obtain either nearly pure t‐ZrO2 or nearly pure m‐ZrO2 simply by changing the reaction time and/or the reaction temperature (Figures 1, 2).
Increasing the reaction time or the reaction temperature tends to favor the formation of m‐ZrO2 at the expense of t‐ZrO2, suggesting that the metastable tetragonal forms first then transforms into the stable monoclinic phase during the solvothermal aging of the gel (e.g. ZNP‐BnOH 200/12 vs. ZNP‐BnOH 200/168, ZNP‐MPK 200/12 vs. ZNP‐MPK 200/168, ZNP‐Ac2O 200/72 vs. ZNP‐Ac2O 240/72, ZCL‐EtOH 110/72 vs. ZCL‐EtOH 150/72, ZCL‐BnOH 110/72 vs. ZCL‐BnOH 180/72).
However, in the reaction of ZNP with Ac2O at 200 °C, t‐ZrO2 formed whatever the reaction time (12 h to 168 h), and in the reaction of ZCL with DIPE, pure t‐ZrO2 was obtained regardless of the reaction temperature (110 °C or 180 °C). It is noteworthy that no water was detected for all of these samples. Actually, although reaction temperature and reaction time are important parameters, the presence of water in the reaction medium has an even more important influence on the crystallinity of the final ZrO2. There is a clear correlation between the crystalline phase of the calcined ZrO2 samples and the amount of water found after reaction. Thus, it is remarkable that strictly non‐hydrolytic syntheses (ZrCl4/DIPE and Zr(OnPr)4/Ac2O at 200 °C) led in all cases to purely tetragonal samples (ZCL‐DIPE 110/72, ZCL‐DIPE 180/72, ZNP‐Ac2O 200/12, ZNP‐Ac2O 200/72, ZNP‐Ac2O 200/168) and that all the reactions with large amounts of water (>1500 ppm) led to predominantly monoclinic samples (% t ≤ 40).
The presence of a significant amount of water in the syneresis liquid after reaction suggests that the formation of the oxide involves, at least in part, hydrolysis/condensation reactions (see paragraph on mechanisms). In addition, water might also play a role during the solvothermal aging of the gel by facilitating the conversion of tetragonal zirconia to monoclinic zirconia.
Solvothermal aging in the presence of water
To investigate the influence of a small amount of water on the solvothermal aging of the gel, we repeated two reactions which led to predominantly tetragonal zirconia (% t ≥ 80): the reactions of Zr(OnPr)4 and Ac2O in toluene at 200 °C for 36 h (ZNP‐Ac2O 200/36) and of Zr(OnPr)4 in MPK at 200 °C for 12 h (ZNP‐MPK 200/12). The gels issued from these reactions were washed, then heated in an autoclave at 200 °C in toluene containing 20 000 ppm H2O. The resulting xerogels and calcined samples (ZNP‐Ac2O 200/36‐W200/36 and ZNP‐MPK 200/12‐W200/12) were characterized by powder X‐ray diffraction and the results are given in Table 3 and Figure 3.
Table 3.
Influence of a solvothermal treatment in 10 mL toluene containing 2 wt % H2O on the crystalline phases before and after calcination.
|
Sample |
Solvothermal |
%t[a] [vol%] |
|
|---|---|---|---|
|
|
treatment |
xerogel |
after calc. |
|
ZNP‐Ac2O 200/72 |
None |
Am. |
100 |
|
ZNP‐Ac2O 200/36‐W200/36 |
36 h at 200 °C |
5 |
5 |
|
ZNP‐MPK 200/12 |
None |
Am. |
90 |
|
ZNP‐MPK 200/12‐W200/12 |
12 h at 200 °C |
35 |
10 |
Figure 3.

Comparison of the powder XRD patterns of calcined ZrO2 samples prepared with (red) or without (blue) a solvothermal treatment with 2 wt % of added water.
In the case of the strictly nonhydrolytic reaction of Zr(OnPr)4 with Ac2O at 200 °C, we know that an amorphous xerogel is obtained whatever the reaction time (12 h to 168 h), and that this xerogel is converted after calcination into a purely tetragonal sample. Remarkably, a solvothermal treatment of 36 h at 200 °C in toluene with only 2 wt % H2O is sufficient to convert the amorphous gel into nearly pure m‐ZrO2 (%t ≤5). A similar effect is observed in the reaction of Zr(OnPr)4 with MPK at 200 °C for 12 h: after a solvothermal treatment of only 12 h at 200 °C in the presence of H2O m‐ZrO2 becomes the major phase in both the xerogel and the final oxide.
In both cases, the presence of water clearly favors the formation of monoclinic ZrO2, even though the crystallite size (8.5 nm for ZNP‐Ac2O 200/36‐W200/36, 5.5 nm for ZNP‐MPK 200/12‐W200/12) remains well below the critical particle size (=30 nm) defined by Garvie and Goss. [17] Gambe and co‐workers recently reported that a solvothermal post‐treatment in mixtures of BnOH and H2O of wet ZrO2 particles obtained by the benzyl alcohol route also favored the monoclinic phase without significant particle growth. [34] This behavior could be explained by a preferential lowering of the surface free energy of m‐ZrO2 particles upon adsorption of water, leading to a decrease of the critical size below which t‐ZrO2 particles can be stabilized, [24] or to the filling of oxygen vacancies by hydroxyl ions. [38]
Avoiding water formation
It is easy to add water, much less to remove it during the reaction, considering that the syntheses are performed in autoclaves. Recently, Gambe et al. demonstrated that by adding sodium as a desiccant in the reaction of benzyl alcohol with Zr(OiPr)4⋅iPrOH they could obtain pure t‐ZrO2 nanoparticles instead of t/m mixtures. [34] Actually, in all the reactions leading to large amounts of water, the O‐donor is also used as a solvent, thus in a large excess. In the case of ZrCl4 the only source of oxygen is the O‐donor. An elegant way to avoid the formation of water would be to use a stoichiometric amount of O‐donor, that is, 2 equiv relative to ZrCl4. Then, all the oxygen would be consumed to give the oxo bridges and, whatever the reactions involved, no water should remain in the reaction medium. To test this hypothesis, we chose three reactions of ZrCl4 with EtOH, BnOH or ACE, which lead, when the O‐donor is used as a solvent, to large amounts of water and to nearly pure m‐ZrO2 (% t ≤ 5). Three samples were prepared under the same conditions but using an inert solvent and a stoichiometric amount (i.e. 2 equiv relative to Zr) of O‐donor (Table 4).
Table 4.
Crystalline phases before and after calcination for zirconia samples prepared from ZrCl4 (8.0 mmol) with a stoichiometric amount (16.0 mmol) of ACE, EtOH or BnOH O‐donors.
|
Sample |
O‐donor |
Solvent |
Conditions |
H2O |
%t[a] [vol%] |
|
|---|---|---|---|---|---|---|
|
name |
|
|
|
[ppm] |
xerogel |
after calc. |
|
ZCL‐EtOH 150/72S |
EtOH |
CH2Cl2, 10 mL |
150 °C, 72 h |
60 |
Am. |
80 |
|
ZCL‐BnOH 180/12S |
BnOH |
Toluene, 10 mL |
180 °C, 12 h |
50 |
Am. |
85 |
|
ZCL‐ACE 200/18S |
ACE |
CH2Cl2, 10 mL |
240 °C, 72 h |
30 |
Am. |
100 |
With a stoichiometric amount of O‐donor, the amount of water found in the liquid phase was very low (<100 pm) and the major phase in the calcined samples was the tetragonal one (% t ≥ 85) (Table 4, Figure 4). The very low amount of water found confirms that even if water formed intermediately, it was completely consumed to form the ZrO2 gel. The fact that the major phase was the tetragonal one is consistent with our previous observations and confirms that in the absence of water the tetragonal phase remains stabilized and formation of monoclinic zirconia is hindered.
Figure 4.

Comparison of the powder XRD patterns of calcined ZrO2 samples prepared from ZrCl4 with a stoichiometric amount of O‐donor (red) or using the O‐donor in large excess as a solvent (blue).
Taken together, our findings underline the crucial importance of water on the crystalline phase of the final ZrO2, which apparently does not depend so much on the mechanism of gel formation (strictly nonhydrolytic or not) than on the presence of water during the solvothermal aging of the gel. Thus, it is possible to reverse the selectivity of syntheses either by adding a small amount of water during the solvothermal aging of the gels or by using a stoichiometric amount of O‐donor to prevent the formation of water.
Part 3: Reactions involved
Having established the main parameters controlling the crystalline phase in the final ZrO2 samples and the crucial role played by water, we used 1H and 13C NMR spectroscopy to identify organic reaction products, in order to determine the reactions responsible for the formation of the oxide network and for the formation of water. The reaction of Zr(OnPr)4 with acetophenone (AcPh) or 2‐pentanone (MPK) at 200 or 240 °C led to complicated mixtures of products, hence we focused on the reactions with the simplest ketone, acetone (ACE). The NMR spectra are displayed in supporting information. The different reactions that we propose are summarized in Scheme 1.
Scheme 1.
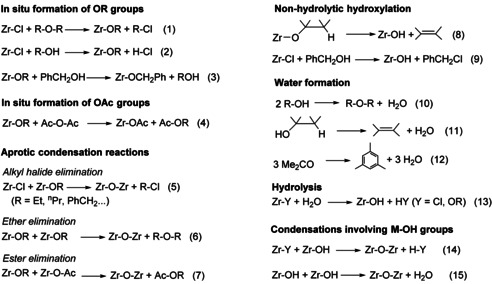
Main reactions proposed for the formation of the oxide network and of water.
Strictly non‐hydrolytic syntheses
The quantification of water in the syneresis liquid (Table 2) indicates that very few syntheses can be considered as strictly non‐hydrolytic: the reaction of ZrCl4 with DIPE at 110 or 180 °C, of Zr(OnPr)4 with Ac2O at 200 °C, and of Zr(OnPr)4 in BnOH at 200 °C.
Reaction of ZrCl4 with DIPE: After reaction of ZrCl4 with DIPE (2.2 equiv) at 110 °C for 72 hours in CH2Cl2 (ZCL‐DIPE 110/72), NMR spectra indicate the presence of isopropyl chloride (88 mol %) and iPr2O (12 mol %) (Figure S3). The formation of isopropyl chloride is consistent with a 2‐step mechanism involving first the formation of Zr‐OiPr groups by etherolysis [Eq. (1) in Scheme 1] then their aprotic condensation with Zr‐Cl groups [Eq. (5)]. The 12 mol % of iPr2O correspond to unreacted excess iPr2O. The same strictly nonhydrolytic mechanism has been reported for the synthesis of TiO2[ 39 , 40 ] and TiO2/C nanocomposites from TiCl4 and DIPE. [41] In addition, very minor signals between 0.7 and 2.0 ppm suggest the presence of alkyl oligomers, likely resulting from the formation of propylene by dehydrochlorination of iPrCl, followed by polymerization.[ 39 , 41 ]
Reaction of Zr(OnPr)4 with Ac2O at 200 °C: After reaction of Zr(OnPr)4 with 2 equiv of Ac2O at 200 °C for 72 h (ZNP‐Ac2O 200/72), NMR spectra indicate the formation of n‐propyl acetate (AcOnPr) only (Figure S4), consistent with a 2‐step mechanism involving acetoxylation [Eq. (4)] then condensation with ester elimination [Eq. (7)], as recently reported for the synthesis of TiO2‐based materials from Ti(OiPr)4 and Ac2O.[ 42 , 43 ] There is no trace of Ac2O, showing that the first step was complete. At 240 °C, the reaction of ZNP with Ac2O is no more strictly non‐hydrolytic, as shown by the significant amount of water (=900 ppm) found after reaction at 240 °C or 270 °C for 72 h (samples ZNP‐Ac2O 240/72 and ZNP‐Ac2O 270/72), possibly related to the decomposition of Zr(OnPr)4 [Eq. (8)] followed by condensation with elimination of H2O [Eq. (15)]. [44]
Reaction of Zr(OnPr)4 with BnOH at 200 °C: After reaction of Zr(OnPr)4 with BnOH at 200 °C (ZNP‐BnOH 200/168) the 13C NMR spectrum (Figure S5) clearly shows the formation of n‐propanol (nPrOH), and dibenzyl ether (Bn2O). Unfortunately, the 1H NMR resonances for BnOH and Bn2O overlap, preventing integration. The formation of Bn2O and nPrOH is in good agreement with the nonhydrolytic mechanism previously reported in the synthesis of ZrO2 [33] or TiO2 [7] nanoparticles, involving transesterification [Eq. (3)] then aprotic condensation with ether elimination [Eq. (6)]. Again, this reaction is no more strictly non‐hydrolytic when it is performed at 240 °C (1160 ppm). The spectra obtained for the sample ZNP‐BnOH 240/24 (Figure S6) are quite similar to those of ZNP‐BnOH 200/168, although many minor peaks are now visible. Accordingly, the formation of water could result from the intermolecular dehydration of BnOH to give BnOBn [Eq. (10)], [7] or from the intramolecular dehydration of nPrOH [Eq. (11)], with formation of propylene, which is too volatile to be detected. [34]
Syntheses with in situ formation of water
As discussed above, significant water formation is observed notably in the reactions of ZNP or ZCL in acetone at 200–240 °C, and in the reaction of ZCL in ethanol at 150 °C or in benzyl alcohol at 180 °C (Table 2).
Reaction of Zr(O n Pr)4 in acetone: After reaction at 240 °C for 72 h (sample ZNP‐ACE 240/72): the 1H and 13C NMR spectra (Figure S7) show the formation of mesitylene, isopropanol (iPrOH), and minor amounts of saturated hydrocarbons (peaks between 0.6 and 2 ppm), as well as other unidentified by‐products. The molar ratio mesitylene : iPrOH : ACE is 1:3.5:19. Minor formation of mesitylene has previously been reported in the synthesis of TiO2 nanoparticles from Ti(OiPr)4 and acetone,[ 7 , 45 ] the major product being mesityl oxide. Both compounds result from aldol condensation of acetone [Eq. (12)]. In our case, the preferential formation of the higher condensation product, mesitylene, suggests that Zr species are more selective catalysts for this reaction than Ti species. Considering the high amount of water in the medium, it is likely that hydrolysis of Zr‐OnPr groups to Zr‐OH groups [Eq. (13)] and condensation with Zr‐OnPr groups [Eq. (14)] or other Zr‐OH groups [Eq. (15)] take place. Both hydrolysis [Eq. (13)] and condensation according to [Eq. (14)] should generate n‐propanol. The fact that only isopropanol was detected suggests that isomerization of n‐propanol took place, which has to be ascribed the harsh reaction conditions used. For comparison, the synthesis of mesitylene from acetone typically involves reacting acetone in concentrated sulfuric acid or heating over an acidic catalyst at high temperature (>200 °C) and high pressure.[ 46 , 47 ]
Reaction of ZrCl4 in acetone at 200 °C: After 18 h (sample ZCl‐ACE 200/18), both 1H and 13C NMR spectra (Figure S8) point to the complete consumption of the acetone. The major byproduct is mesitylene (as in the reaction of Zr(OnPr)4 in acetone), indicating extensive aldol condensation and water formation [Eq. (12)], in agreement with the water phase found in the syneresis liquid. In addition, numerous signals corresponding to saturated aliphatic and aromatic byproducts are found. These byproducts most likely arise from the polymerization of light olefins formed by decomposition of mesityl oxide and other aldol condensation products, which was reported to be catalyzed by Brønsted acidic sites in zeolites at 150–250 °C and leads to the formation of isobutylene, but also of propylene, ethylene and aromatics. [48] Actually, light olefin synthesis from acetone over zeolite catalysts in gas phase has been widely investigated. In these syntheses, selective formation of lighter olefins is due to the molecular sieving effect of the zeolite. [49] In our case, there is no such effect and polymerization is not prevented.
Reaction of ZrCl4 in EtOH at 150 °C: After 72 h of reaction (sample ZCL‐EtOH 150/72), NMR spectra indicate the formation of Et2O and EtCl only (Figure S9). From the integration of the 1H NMR spectrum and the initial molar ratio of reactants (EtOH:ZrCl4=12.9:1), we find that 2.6 moles of Et2O and 1.6 moles of EtCl were produced for one mole of ZrCl4. The formation of water (11 500 ppm) and Et2O most likely results from the condensation between two EtOH molecules [Eq. (10)], catalyzed by Zr species and/or HCl. This reaction is relatively slow: over the 72 h of reaction, less than half the EtOH was converted to Et2O, nevertheless generating more than enough water to fully hydrolyze and condense the precursor. However, the presence of EtCl suggests that a nonhydrolytic mechanism involving alkoxylation [Eq. (2)] and condensation with EtCl elimination [Eq. (5)] is operative.
According to the literature, the alkoxylation starts even at room temperature but this reaction is not complete and leads to the formation of a mixture of chloroethoxides, mainly Zr(OEt)2Cl2.EtOH and Zr(OEt)Cl3.EtOH. [50] At 150 °C, these chloroethoxides condense rapidly to form Zr‐O‐Zr bonds according to [Eq. (5)]. The amount of EtCl formed (EtCl:Zr = 1.6:1) corresponds to 80 % of the amount expected for a complete nonhydrolytic condensation. Accordingly, only about 20 % of the oxo bridges would be formed by a hydrolytic mechanism [Eqs. (13–15)].
Interestingly, when the reaction was performed using a stoichiometric amount of EtOH, that is, 2 moles per mole of ZrCl4 (sample ZCl‐EtOH 150/72S), no water was detected (meaning that all the EtOH was consumed to give alkoxide groups, [Eq. (2)] and the only byproduct detected by 1H and 13C NMR spectroscopy of the syneresis liquid was EtCl (Figure S10) suggesting that all of the oxo bridges formed according to [Eq. (5)], by a fully nonhydrolytic mechanism. As a result, the solvothermal “aging” takes place under anhydrous conditions, leading to an amorphous ZrO2 xerogel converted to t‐ZrO2 upon calcination.
Reaction of ZrCl4 in BnOH: After reaction of ZrCl4 in BnOH at 110 °C for 12 h (sample ZCl‐BnOH 110/12), there was no syneresis liquid. To extract organic byproducts and water, the gel was crushed under argon in anhydrous EtOH. Karl Fischer titration of this ethanolic solution indicated the formation of a significant amount of water (6 100 ppm). Besides EtOH, The 1H and 13C NMR spectra of the resulting solution (Figure S11) clearly show the presence of BnOH, BnCl and Bn2O. Based on the integration of the 1H NMR spectrum and the initial molar ratio of reactants, about 70 % of the benzyl alcohol was consumed during the reaction, 30 % to give BnCl and 40 % to form Bn2O. The formation of BnCl could result from an alkoxylation/condensation process [Eq. (2) and (5)] but it is more probably due to the nonhydrolytic hydroxylation of Zr‐Cl groups [Eq. (9)], which is favored over alkoxylation in the case of tertiary and benzylic alcohols, able to form stable carbocations.[ 3 , 7 ] The Zr‐OH groups formed by this nonhydrolytic hydroxylation would then condense according to [Eq. (14)] or [Eq. (15)], leading to the elimination of HCl or water, respectively. The formation of Bn2O most likely results from the dehydration between two BnOH molecules [Eq. (10)], catalyzed by Zr species and/or HCl.
Reaction at 180 °C (sample ZCl‐BnOH 180/12) also leads to BnCl, Bn2O and H2O, indicating the occurrence of the same reactions as at 110 °C (Figure S12). In addition, other side reactions take place, leading to short poly(phenylene methylene) oligomers. The formation of such oligomers has previously been reported in the reaction of benzyl alcohol with iron[ 51 , 52 ] or tungsten precursors. [53] Poly(phenylene methylene) may result from the direct polymerization of BnOH, but also of BnCl or Bn2O byproducts. [7] Close inspection of the 1H NMR spectrum shows the presence of CH2Cl chain ends, indicating that BnCl did participate to the polymerization [Eq. 16]. [54] According to the integration of the 1H NMR spectrum, more than 90 % of the benzyl alcohol was converted during the reaction, 43 % to BnCl, 23 % to Bn2O and 25 % to poly(phenylene methylene) oligomers.

Part 4: Texture and morphology of selected samples
Based on their phase purity and their specific surface area, we selected four samples for further characterization: two samples with a predominantly monoclinic structure (ZCL‐EtOH 150/72 and ZNP‐ACE 240/72), and two samples with a predominantly tetragonal structure (ZCL‐DIPE 110/72 and ZNP‐AcPh 200/12). In addition, to illustrate the evolution of the texture with reaction conditions, we also selected samples prepared from ZNP and Ac2O at different temperatures (200, 240, and 270 °C) for 72 h, and samples prepared from ZNP and MPK at 200 °C with different reaction times (12, 72, and 168 h). Relevant structural and textural data for these samples are given in Table 5.
Table 5.
XRD and N2 physisorption data for the selected ZrO2 samples.
|
Sample |
Phase[a] |
d cryst [b] [nm] |
S geom [c] [m2 g−1] |
S BET [d] [m2 g−1] |
V p [e] [cm3 g−1] |
D p [f] [nm] |
|---|---|---|---|---|---|---|
|
ZCL‐EtOH 150/72 |
95 % m‐ZrO2 |
5.5 |
180 |
130 |
0.30 |
5.9 |
|
ZNP‐ACE 240/72 |
95 % m‐ZrO2 |
7.0 |
140 |
85 |
0.17 |
5.9 |
|
ZCL‐DIPE 110/72 |
100 % t‐ZrO2 |
9.0 |
110 |
95 |
0.18 |
6.1 |
|
ZNP‐MPK 200/12 |
95 % t‐ZrO2 |
6.0 |
165 |
80 |
0.07 |
3.4 |
|
ZNP‐MPK 200/72 |
65 % t‐ZrO2/ 35 % m‐ZrO2 |
6.5 5.5 |
165 |
80 |
0.11 |
4.5 |
|
ZNP‐MPK 200/168 |
85 % m‐ZrO2 |
5.0 |
200 |
110 |
0.19 |
5.4 |
|
ZNP‐Ac2O 200/72 |
100 % t‐ZrO2 |
7.5 |
135 |
<5 |
<0.01 |
/ |
|
ZNP‐Ac2O 240/72 |
85 % m‐ZrO2 |
6.5 |
155 |
80 |
0.11 |
4.7 |
|
ZNP‐Ac2O 270/72 |
90 % m‐ZrO2 |
6.0 |
165 |
95 |
0.36 |
12.1 |
[a] Percentage of the main crystalline phase. [b] Average crystallite size for the major phase, determined by the Scherrer method. [c] Geometric specific surface area calculated from the average crystallite size assuming a density of 6 and a spherical shape. [d] Specific surface area obtained by the BET method. [e] Total pore volume at P/P 0 = 0.98. [f] Average pore size calculated by the BJH method from the desorption isotherm.
Electron microscopy images show that the calcined samples are built of aggregated primary t‐ or m‐ZrO2 nanocrystals, between =5 and 9 nm in size, in good agreement with the crystallite size derived from XRD patterns (Table 5 and Figures 5 and 6). At the micron scale, the samples present two different morphologies depending on the precursor and O‐donor: in ZNP‐Ac2O, ZCl‐EtOH or ZCL‐DIPE samples the nanocrystals form shapeless, very large aggregates, while in ZNP‐MPK, ZNP‐ACE and ZNP‐AcPh they build spherical secondary particles, 1 to 5 μm in size. Similar hierarchical morphologies have already been reported for TiO2‐based materials prepared by NHSG using DIPE or Ac2O O‐donors.[ 41 , 42 , 55 ] As shown in Figure 6, these two types of morphologies are already present in the xerogels, prior to calcination.
Figure 5.

SEM and TEM images for ZCL‐EtOH 150/72 (95 % m‐ZrO2) (a) and ZCL‐DIPE 110/72 (100 % t‐ZrO2) (b).
Figure 6.

SEM images for ZrO2 samples obtained from ZNP and MPK, ACE or Ac2O under different conditions.
The texture of the samples directly depends on how the ZrO2 nanocrystals assemble in the aggregates during the synthesis, drying and calcination steps. Indeed, these nanocrystals are nonporous, thus the specific surface area (S BET) arises from the accessible geometric surface area (S geom) of the nanocrystals, and the pore volume (V P) from the voids between them. If there was no sintering of the nanoparticles, the contact area between the NPs would be negligible, and S BET would be close to S geom. In all cases S BET is lower than the geometric surface area, indicating significant sintering of the nanocrystals (Table 5). Sintering appears particularly important for ZNP‐Ac2O 200/72, which displays a very low S BET value despite a particle size of 7.5 nm.
Just as the crystalline phase, the texture depends on the reaction temperature and/or the reaction time. Accordingly, it is not really possible to independently control the structure and the texture of the final oxide. For instance, in the reaction of ZNP with MPK at 200 °C, increasing the reaction time from 12 to 168 h leads to a nearly complete transformation of t‐ZrO2 into m‐ZrO2. Simultaneously, S BET and V p increase, from 80 m2 g−1 to 110 m2 g−1 and from 0.07 cm3 g−1 to 0.19 cm3 g−1, respectively (Table 5, Figure 7 b, c). SEM images (Figure 6) indicate a moderate growth and sintering of the secondary particles. The significant increase in pore volume suggests that the solvothermal aging leads to a stronger primary particles network which resists better to the drying and calcination steps. In the reaction of ZNP with Ac2O, increasing the reaction temperature from 200 °C to 270 °C changes the structure from pure t‐ZrO2 to nearly pure m‐ZrO2. This is accompanied by a spectacular increase of S BET (from less than 5 m2 g−1 to 95 m2 g−1) and of the pore volume (from less than 0.01 cm3 g−1 to 0.36 cm3 g−1) (Figure 7 d). This change in texture is not due to a change in crystallite size, which remains practically constant, but to a lower sintering of the particles, leading to much less dense aggregates, as can be seen in SEM images (Figure 6 c, f, i).
Figure 7.

N2 physisorption isotherms at 77 K and corresponding BJH pore size distribution of selected m‐ZrO2 (a), t‐ZrO2 samples (b), and of additional ZNP‐MPK (c) and ZNP‐Ac2O samples (d).
The nitrogen physisorption isotherms of the different oxides (Figure 7) are of Type IV, characteristic of mesoporous adsorbents, with Type H2 hysteresis loops, suggesting the presence of ink bottle‐shaped pores. [56] The pore size distributions confirm the presence of mesopores. The distribution is particularly large in the case of ZCL‐EtOH 150/72, and to a lesser extent of ZCL‐DIPE 110/72. Conversely, the distribution is quite narrow for ZNP‐ACE 240/72, which displays well‐calibrated pores in the 5 to 7 nm range, due to the relatively dense packing of well‐calibrated nanoparticles (Figure 6 e). The average pore size in these three samples are similar, around 6 nm. The average pore size of ZNP‐MPK 200/12 is much lower (3.4 nm), and the sharp pore size distribution is likely due to cavitation‐induced evaporation, indicating the presence of mesopores below ≈5 nm). [56]
Conclusions
The first objective of this work was to assess the in situ formation of water in NHSG routes. Among all the syntheses tested, very few appear strictly non‐hydrolytic. This is the case only for the reactions of ZNP with Ac2O or BnOH at moderate temperature (200 °C) and of ZCL with DIPE, in which no organic reaction produces hydroxyl groups or water and the oxide network results from aprotic condensations. In all other syntheses, significant water formation takes place via alcohol dehydration (reaction of ZCL with EtOH or BnOH and possibly of ZNP with BnOH at 240 °C) or aldol condensation (reaction of ACE with ZNP or ZCL), suggesting that the mechanism of formation of these samples is, at least in part, hydrolytic.
The second objective was to prepare mesoporous ZrO2 supports with a controlled tetragonal or monoclinic structure. Although reaction time and reaction temperature were important parameters in controlling the crystalline phase, the presence of water played an even more important role: the formation of t‐ZrO2 is favored in the absence of water, while m‐ZrO2 forms preferentially when a significant amount of water is present. Based on these observation, we could reverse the selectivity of several reactions by two different methods. Thus, adding a small amount of water during the solvothermal aging of the gels favored the formation of m‐ZrO2 instead of t‐ZrO2. Conversely, using a stoichiometric amount of O‐donor completely prevented the formation of water, as all the oxygen atoms were consumed to form the oxide, and this clearly favored the formation of t‐ZrO2 instead of m‐ZrO2. The texture of the final ZrO2 materials does not appear related to the formation of water, but by varying the precursor, the O‐donor and the reaction conditions we could obtain practically phase pure (≥95 %) t‐ or m‐ZrO2 mesoporous supports with specific surface areas up to 130 m2 g−1 after calcination for 5 h at 500 °C in air.
This study illustrates the richness of NHSG process and the crucial importance of the organic reactions involved. It confirms the interest of NHSG for the synthesis of metal oxide mesoporous supports or catalysts, in the absence of templates and reactivity modifiers. Our next goal will be to apply these routes to the synthesis of t‐ and m‐ZrO2 supports doped with other oxides for catalytic applications.
Experimental Section
Chemicals
Zirconium(IV) propoxide (Zr(OnPr)4, 70 % in 1‐propanol) and zirconium (IV) chloride (ZCL, 99.9 %) were purchased from Sigma–Aldrich. Anhydrous benzyl alcohol (BnOH, 99.8 %), diisopropylether (DIPE, 99 %) and acetophenone (AcPh, 99 %) were also purchased from Sigma–Aldrich. Acetic anhydride (Ac2O, 99 %), ethanol (EtOH, 99.5 %) and anhydrous acetone (ACE, 99.8 %) were purchased from ACROS Organics. 2‐pentanone (MPK, 99.5 %) was purchased from Alfa Aesar. Zirconium(IV) propoxide (Zr(OnPr)4, 70 % in 1‐propanol) was treated before use for 15 h under primary vacuum at 120 °C to remove 1‐propanol and obtain pure Zr(OnPr)4 (ZNP). Complete removal of 1‐propanol was checked by FTIR spectrometry, by the absence of the OH stretching band from the alcohol (Figure S1). The water content of all oxygen donors was measured by Karl Fischer titration and, if necessary, they were dried over molecular sieves to ensure adequate drying (<10 ppm H2O for Ac2O, DIPE; <20 ppm for ACE, MPK, AcPh; <50 ppm H2O for EtOH, BnOH). Toluene (Sigma‐Aldrich, 99.7 %) and dichloromethane (Sigma–Aldrich, 99.8 %) were dried over a PureSolve MD5 solvent purification system (H2O <10 ppm, controlled with by Karl Fischer titration).
Synthesis of ZrO2 materials
ZrO2 samples were prepared from Zr(OnPr)4 (ZNP) or ZrCl4 (ZCL) using different O‐donors: acetic anhydride (Ac2O), benzyl alcohol (BnOH), acetophenone (AcPh), 2‐pentanone (MPK), acetone (ACE), ethanol (EtOH), or diisopropylether (DIPE). The amounts of precursor, O‐donor and solvent (if any), the reaction temperature and reaction time are summarized in Table 1 in main text.
Samples from Zr(OnPr)4: In a typical synthesis (ZNP‐BnOH 200/24), BnOH (10 mL, 96 mmol) was slowly added to 5.3 mmol (1.74 g) of purified Zr(OnPr)4 (without 1‐propanol). After stirring for 5 min, the resulting solution was transferred to a 23 mL stainless steel autoclave (Parr Instruments) with a PTFE lining. To avoid water, these manipulations were carried out in a glovebox under argon atmosphere (<10 ppm of water and O2). The sealed autoclave was then heated at 200 °C for 24 h in an oven, under autogenous pressure. After reaction, the liquid phase (syneresis liquid) was immediately collected for Karl Fischer and NMR characterization. The gel was thoroughly washed with ether (5×30 mL), EtOH (5×30 mL) and acetone (5×30 mL). Then, it was dried under vacuum (100 Pa) at 120 °C for 5 h. Part of the xerogel was kept for characterization, the rest was calcined in a muffle furnace at 500 °C (heating rate 10 °C min−1) for 5 h in ambient air. The final oxide was ground into a fine powder for characterization.
To study the influence of water in the solvothermal aging of the gels, two gels were prepared as described above (ZNP‐Ac2O 200/36 and ZNP‐ACE 200/12). However, after opening the autoclave, the gels were washed 3 times with dry toluene, then put in an autoclave with 10 mL of toluene containing 2 wt % (20 000 ppm) of water. The autoclaves were then sealed and heated at 200 °C for 36 h (ZNP‐Ac2O 200/36) or 12 h (ZNP‐ACE 200/12). After heating, the gels were washed, dried and calcined as described above to give ZNP‐Ac2O 200/36‐W200/36 and ZNP‐ACE 200/12‐W200/12.
Samples from ZrCl4: To ensure complete dissolution of ZrCl4, high purity (≥99.9 %) ZrCl4 was stirred with the O‐donor and the solvent (if any) for 30 min. In the case of alcohol O‐donors (EtOH, BnOH) the reactants (and solvent, if any) were mixed for 30 min outside the glovebox in a Schlenk tube connected to a Schlenk line under argon to avoid evolution of HCl inside the glovebox. After reaction the gels were washed 3 times with 50 mL CH2Cl2, otherwise the protocol was the same as for the samples prepared from Zr(OnPr)4.
Characterization
Powder X‐ray diffraction (XRD) patterns were collected with a PANalytical X′Pert Pro MPD diffractometer with the CuKα radiation between 20 and 70° (2θ), with a step of 0.05°. The volume percentage of t‐ZrO2 phase (%t‐ZrO2) was calculated from the ratio χ calculated from the areas of the (101) peak of t‐ZrO2 and of the (−111) and (111) peaks of m‐ZrO2, [37] according to:
The areas of the different peaks were measured using the X′Pert HighScore software, by deconvolution of the kα1 line. The crystallite size was calculated using the same software. Fourier‐transform infrared (FTIR) spectra were collected in ATR mode on a Spectrum II PerkinElmer spectrometer. Scanning electron microscopy (SEM) images were obtained with a Hitachi S‐4800 electron microscope. High‐resolution transmission electron microscopy (TEM) images were obtained using a JEOL 2200FS‐200 kV instrument. Nitrogen physisorption isotherms were measured at 77 K with a Micrometrics Triflex apparatus; the specific surface area was determined by the BET method, the pore size distribution in the 2 to 100 nm range by the BJH method from the desorption branch. 1H and 13C NMR spectra in solution were recorded using a Bruker AVANCE 400 MHz spectrometer. The water content in the syneresis liquid was measured on a coulometric Karl Fischer titrator (SI‐Analytics TitroLine KF 7500 KF Trace), using the Hydranal Coulomat AK reagent for ketones O‐donors and Hydranal Coulomat E reagent for all other O‐donors.
Supporting information available
FTIR spectra, N2 physisorption isotherms, 1H and 13C NMR spectra of syneresis liquids.
Conflict of interest
The authors declare no conflict of interest.
Supporting information
As a service to our authors and readers, this journal provides supporting information supplied by the authors. Such materials are peer reviewed and may be re‐organized for online delivery, but are not copy‐edited or typeset. Technical support issues arising from supporting information (other than missing files) should be addressed to the authors.
Supplementary
Acknowledgements
Financial support for this work was received from the European Union in the framework of H‐CCAT project (NMBP Program Horizon 2020) under grant agreement 720996, and from the French funding agency “Agence Nationale de la Recherche”, project NHYSCAB, grant number ANR‐16‐CE07‐0010. The authors would like to thank Didier Cot (IEM, France) for SEM analyses, and Erwan Oliviero (ICGM) for high resolution TEM analyses.
Y. Wang, M. Bouchneb, R. Mighri, J. G. Alauzun, P. H. Mutin, Chem. Eur. J. 2021, 27, 2670.
References
- 1. Styskalik A., Skoda D., Barnes C., Pinkas J., Catal. 2017, 7, 168. [Google Scholar]
- 2. Debecker D. P., Hulea V., Mutin P. H., Appl. Catal. A 2013, 451, 192–206. [Google Scholar]
- 3. Vioux A., Chem. Mater. 1997, 9, 2292–2299. [Google Scholar]
- 4. Jun Y.-w., Choi J.-s., Cheon J., Angew. Chem. Int. Ed. 2006, 45, 3414–3439; [DOI] [PubMed] [Google Scholar]; Angew. Chem. 2006, 118, 3492–3517. [Google Scholar]
- 5. Mutin P. H., Vioux A., Chem. Mater. 2009, 21, 582–596. [Google Scholar]
- 6. Pinna N., Karmaoui M., Willinger M.-G., J. Sol-Gel Sci. Technol. 2011, 57, 323–329. [Google Scholar]
- 7. Deshmukh R., Niederberger M., Chem. Eur. J. 2017, 23, 8542–8570. [DOI] [PubMed] [Google Scholar]
- 8. Cadman C. J., Pucci A., Cellesi F., Tirelli N., Adv. Funct. Mater. 2014, 24, 993–1003. [Google Scholar]
- 9. Yamaguchi T., Catal. Today 1994, 20, 199–218. [Google Scholar]
- 10. Srinivasan R., Davis B. H. in Materials Synthesis and Characterization (Ed.: Perry D. L.), Springer Boston, 1997, pp. 147–188. [Google Scholar]
- 11. Kauppi E. I., Honkala K., Krause A. O. I., Kanervo J. M., Lefferts L., Top. Catal. 2016, 59, 823–832. [Google Scholar]
- 12. Bachiller-Baeza B., Rodriguez-Ramos I., Guerrero-Ruiz A., Langmuir 1998, 14, 3556–3564. [Google Scholar]
- 13. Samson K., Śliwa M., Socha R. P., Góra-Marek K., Mucha D., Rutkowska-Zbik D., Paul J. F., Ruggiero-Mikołajczyk M., Grabowski R., Słoczyński J., ACS Catal. 2014, 4, 3730–3741. [Google Scholar]
- 14. Sato A. G., Volanti D. P., Meira D. M., Damyanova S., Longo E., Bueno J. M. C., J. Catal. 2013, 307, 1–17. [Google Scholar]
- 15. Li W., Huang H., Li H., Zhang W., Liu H., Langmuir 2008, 24, 8358–8366. [DOI] [PubMed] [Google Scholar]
- 16. Stichert W., Schüth F., Kuba S., Knözinger H., J. Catal. 2001, 198, 277–285. [Google Scholar]
- 17. Garvie R. C., Goss M. F., J. Mater. Sci. 1986, 21, 1253–1257. [Google Scholar]
- 18. Mitsuhashi T., Ichihara M., Tatsuke U., J. Am. Ceram. Soc. 1974, 57, 97–101. [Google Scholar]
- 19. Osendi M. I., Moya J. S., Serna C. J., Soria J., J. Am. Ceram. Soc. 1985, 68, 135–139. [Google Scholar]
- 20. Whitney E. D., Trans. Faraday Soc. 1965, 61, 1991–2000. [Google Scholar]
- 21. Stefanic G., Musić S., Croat. Chem. Acta 2003, 75, 727–767. [Google Scholar]
- 22. Tyagi B., Sidhpuria K., Shaik B., Jasra R. V., Ind. Eng. Chem. Res. 2006, 45, 8643–8650. [Google Scholar]
- 23. Chuah G. K., Jaenicke S., Pong B. K., J. Catal. 1998, 175, 80–92. [Google Scholar]
- 24. Xie S., Iglesia E., Bell A. T., Chem. Mater. 2000, 12, 2442–2447. [Google Scholar]
- 25. Jansen M., Guenther E., Chem. Mater. 1995, 7, 2110–2114. [Google Scholar]
- 26. Warwar Damouny C., Khoury C., Gazit O. M., J. Am. Ceram. Soc. 2019, 102, 456–464. [Google Scholar]
- 27. Joo J., Yu T., Kim Y. W., Park H. M., Wu F., Zhang J. Z., Hyeon T., J. Am. Chem. Soc. 2003, 125, 6553–6557. [DOI] [PubMed] [Google Scholar]
- 28. Goto Y., Omata T., Otsuka-Yao-Matsuo S., J. Electrochem. Soc. 2009, 156, K4–K9. [Google Scholar]
- 29. Gateshki M., Petkov V., Hyeon T., Joo J., Niederberger M., Ren Y., Solid State Commun. 2006, 138, 279–284. [Google Scholar]
- 30. Garnweitner G., Goldenberg L. M., Sakhno O. V., Antonietti M., Niederberger M., Stumpe J., Small 2007, 3, 1626–1632. [DOI] [PubMed] [Google Scholar]
- 31. Cheema T. A., Garnweitner G., CrystEngComm 2014, 16, 3366–3375. [Google Scholar]
- 32. Stolzenburg P., Freytag A., Bigall N. C., Garnweitner G., CrystEngComm 2016, 18, 8396–8405. [Google Scholar]
- 33. De Keukeleere K., De Roo J., Lommens P., Martins J. C., Van Der Voort P., Van Driessche I., Inorg. Chem. 2015, 54, 3469–3476. [DOI] [PubMed] [Google Scholar]
- 34. Gambe J., Rémondière F., Jouin J., Portal L., Thomas P., Masson O., Inorg. Chem. 2019, 58, 15175–15188. [DOI] [PubMed] [Google Scholar]
- 35. Tana F., Messori M., Contini D., Cigada A., Valente T., Variola F., De Nardo L., Bondioli F., Prog. Org. Coat. 2017, 103, 60–68. [Google Scholar]
- 36. Srinivasan R., De Angelis R. J., Ice G., Davis B. H., J. Mater. Res. 1991, 6, 1287–1292. [Google Scholar]
- 37. Toraya H., Yoshimura M., Somiya S., J. Am. Ceram. Soc. 1984, 67, C119-C121. [Google Scholar]
- 38. Guo X., Chem. Mater. 2004, 16, 3988–3994. [Google Scholar]
- 39. Arnal P., Corriu R. J. P., Leclercq D., Mutin P. H., Vioux A., J. Mater. Chem. 1996, 6, 1925–1932. [Google Scholar]
- 40. Aboulaich A., Boury B., Mutin P. H., Chem. Mater. 2010, 22, 4519–4521. [Google Scholar]
- 41. Escamilla-Pérez A. M., Louvain N., Boury B., Brun N., Mutin H., Chem. Eur. J. 2018, 24, 4982–4990. [DOI] [PubMed] [Google Scholar]
- 42. Wang Y., Kim S., Louvain N., Alauzun J., Mutin H., Chem. Eur. J. 2019, 25, 4767–4774. [DOI] [PubMed] [Google Scholar]
- 43. Wang Y., Alauzun J. G., Mutin P. H., Chem. Mater. 2020, 32, 2910–2918. [Google Scholar]
- 44. Inoue M., Kominami H., Inui T., Appl. Catal. A 1993, 97, L25–L30. [Google Scholar]
- 45. Garnweitner G., Antonietti M., Niederberger M., Chem. Commun. 2005, 397–399. [DOI] [PubMed] [Google Scholar]
- 46. Adams R., Hufferd R. W., Org. Synth. 1922, 2, 63. [Google Scholar]
- 47. Salvapati G. S., Ramanamurty K. V., Janardanarao M., J. Mol. Catal. 1989, 54, 9–30. [Google Scholar]
- 48. Kubelková L., Nováková J., Zeolites 1991, 11, 822–826. [Google Scholar]
- 49. Tago T., Konno H., Ikeda S., Yamazaki S., Ninomiya W., Nakasaka Y., Masuda T., Catal. Today 2011, 164, 158–162. [Google Scholar]
- 50. Mehrotra R. C., J. Non-Cryst. Solids 1988, 100, 1–15. [Google Scholar]
- 51. Hu M., Xu J., Gao J., Yang S., Wong J. S. P., Li R. K. Y., Dalton Trans. 2013, 42, 9777–9784. [DOI] [PubMed] [Google Scholar]
- 52. Silva F. B. F., Paris E. C., da Costa G. M., Ribeiro C., RSC Adv. 2014, 4, 53265–53272. [Google Scholar]
- 53. Olliges-Stadler I., Rossell M. D., Niederberger M., Small 2010, 6, 960–966. [DOI] [PubMed] [Google Scholar]
- 54. Braendle A., Schwendimann P., Niederberger M., Caseri W. R., J. Polym. Sci. Part A 2018, 56, 309–318. [Google Scholar]
- 55. Debecker D. P., Bouchmella K., Delaigle R., Eloy P., Poleunis C., Bertrand P., Gaigneaux E. M., Mutin P. H., Appl. Catal. B 2010, 94, 38–45. [Google Scholar]
- 56. Thommes M., Kaneko K., Neimark Alexander V., Olivier James P., Rodriguez-Reinoso F., Rouquerol J., Sing Kenneth S. W., Pure Appl. Chem. 2015, 87, 1051. [Google Scholar]
Associated Data
This section collects any data citations, data availability statements, or supplementary materials included in this article.
Supplementary Materials
As a service to our authors and readers, this journal provides supporting information supplied by the authors. Such materials are peer reviewed and may be re‐organized for online delivery, but are not copy‐edited or typeset. Technical support issues arising from supporting information (other than missing files) should be addressed to the authors.
Supplementary