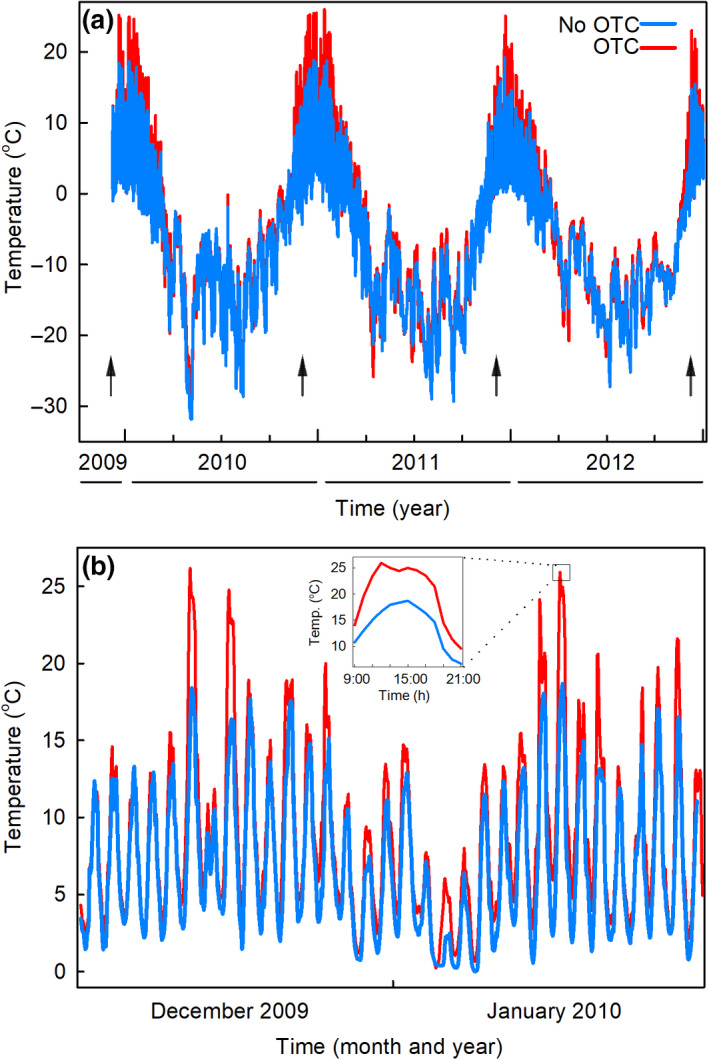
FIGURE 2.

Soil temperatures measured at Mars Oasis in unchambered control plots and open top chamber (OTC) plots. (a) Soil temperatures recorded hourly at 25–30 mm depth between December 2009 and December 2012. Arrows denote samplings. (b) Soil temperatures recorded hourly at 25–30 mm depth between 15 December 2009 and 15 January 2010. Values shown in (a) and (b) are means of temperatures in three OTC plots and three unchambered plots. Inset in (b) shows mean soil temperatures recorded hourly from 9:00 to 21:00 on 8 January 2010
