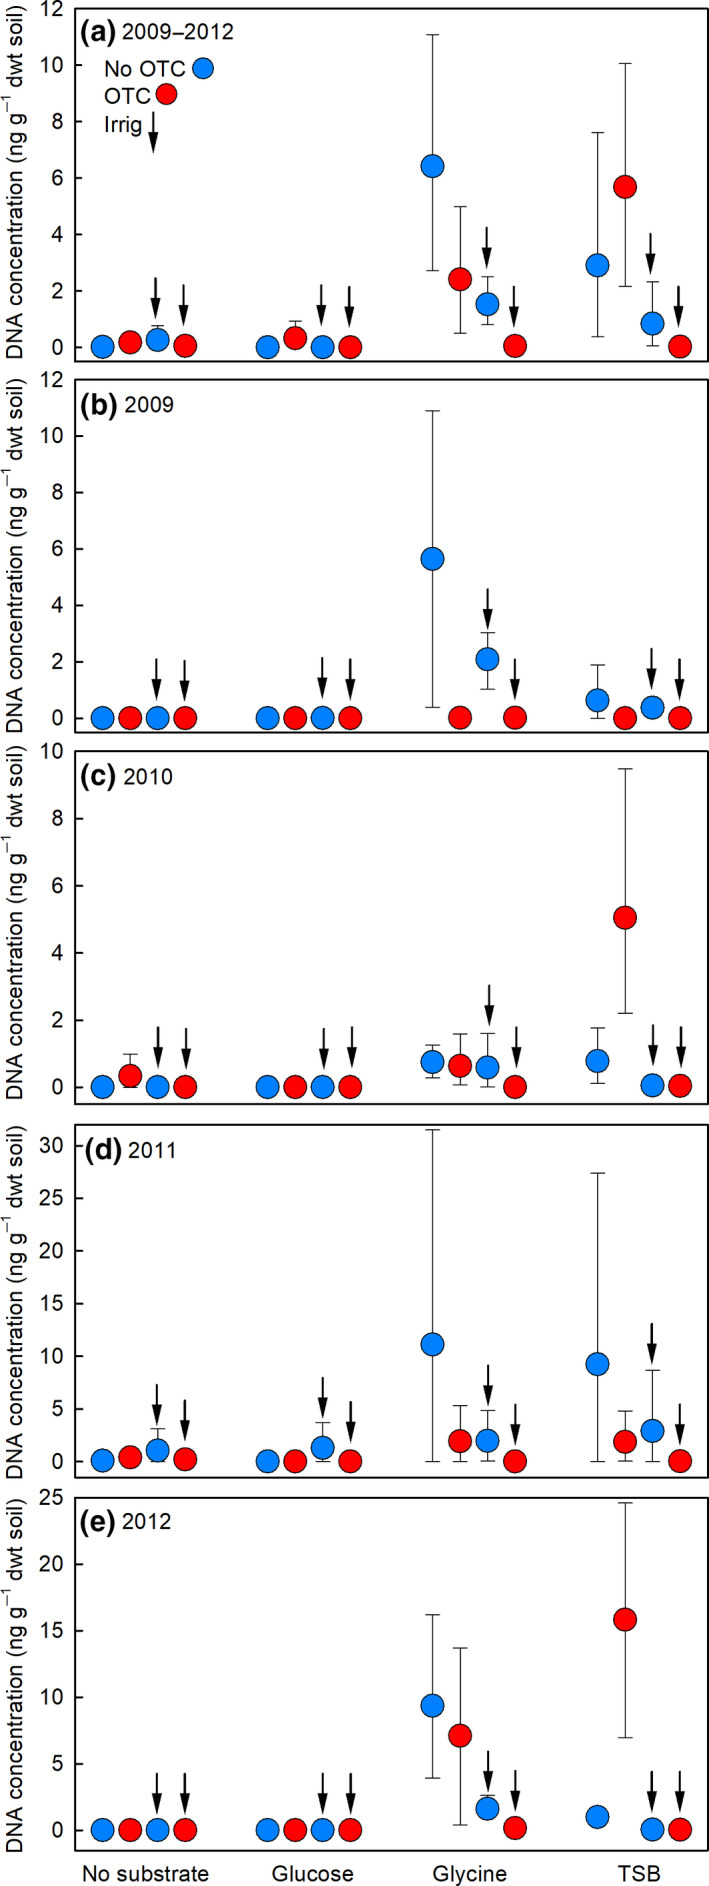
FIGURE 4.

Concentrations of Pseudogymnoascus roseus DNA in Mars Oasis soil measured using quantitative polymerase chain reaction assays. Values are DNA concentrations (a) averaged across 2009–2012 and in (b–e) individual years in soils receiving no substrate, glucose, glycine, or tryptone soy broth (TSB) and a factorial combination of warming (applied with open top chambers, OTCs) and irrigation (irrig). Values are means of four replicates ± 95% bootstrap confidence intervals. See Table 1 for an ANOVA table summarizing the treatment effects
