Figure 4.
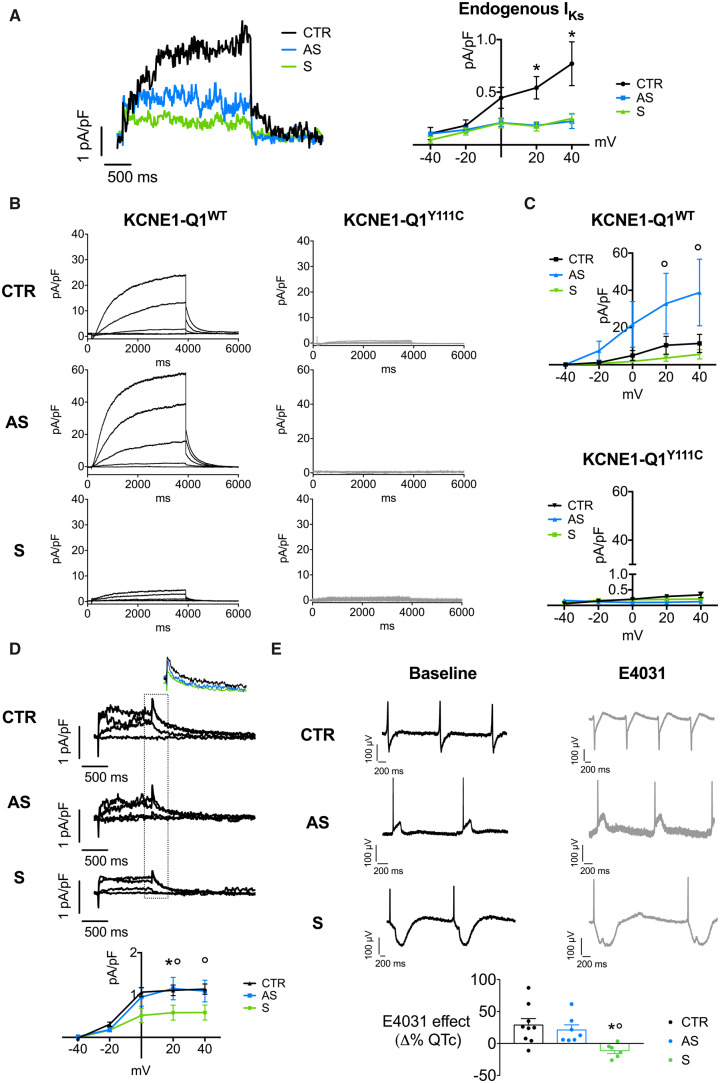
Electrophysiological characterization of LQT-iPSC-CMs. (A) Voltage-clamp recordings of endogenous IKs in CTR- and Y111C-iPSC-CMs. Representative traces (left) and average current–voltage (I–V) relationships (right) of endogenous IKs from CTR- (black), AS- (blue), S-iPSC-CMs (green). (B and C) Voltage-clamp recordings of heterologous IKs current in CTR- and LQT-iPSC-CMs transiently transfected with VSV-E1-Q1-GFP WT or Y111C. Representative patch-clamp recordings (B) and average I–V relationships (C) of heterologous IKs from CTR-, AS-, and S-iPSC-CMs transfected with VSV-E1-Q1-GFP WT or Y111C plasmids. (D) Voltage-clamp recordings of endogenous IKr. Representative IKr recordings (top panel) and average data (bottom panel) for CTR-, AS-, and S-iPSC-CMs. IKr tail currents have been magnified and overlaid in the inset. (E) Response to IKr blocking. Representative field potentials recorded with MEA in CTR-, AS-, and S-iPSC-CMs at baseline (top left, black) and after IKr block with E4031 (top right, grey). Average data (bottom panel) are expressed as delta percentage of the effect vs. the respective baseline (n = 14–19 for patch-clamp data; n = 6–9 for MEA data; *P < 0.05 CTR vs. S; °P < 0.05 AS vs. S).

