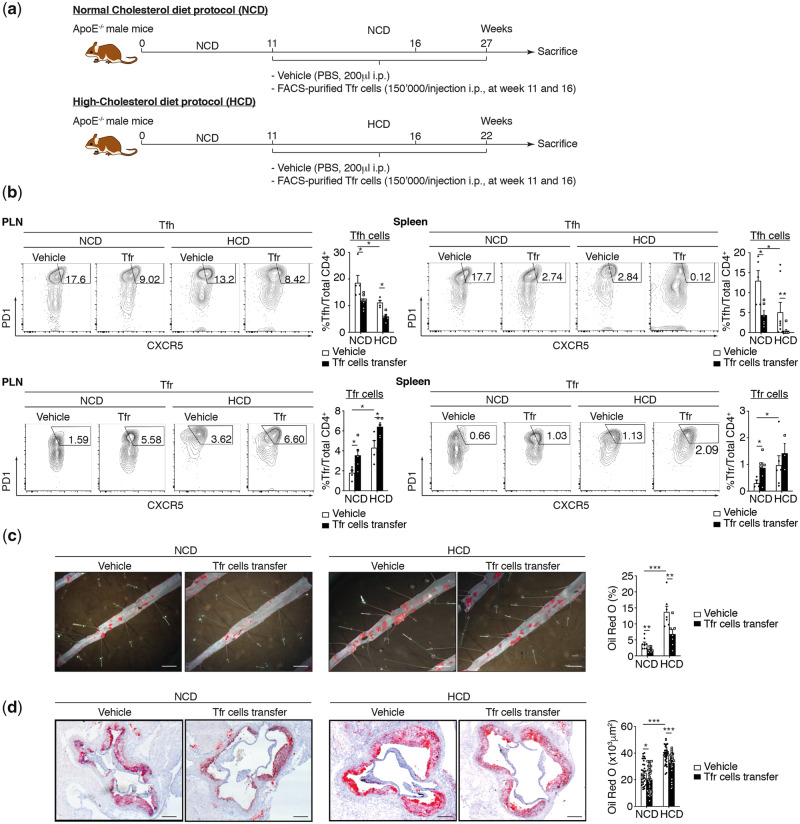
Figure 2.
TFR cell population regulates atherogenesis in HCD. (A) Mouse atherosclerosis protocols and adoptive transfer strategy. (B) Effect of TFR cell transfer on secondary lymphoid organs TFH and TFR populations on NCD and HCD fed mice (PLN TFH: n = 4–7 mice/group; PLN TFR: n = 4–5 mice/group; spleen TFH: n = 4–8 mice/group; spleen TFR: n = 3–6 mice/group). (C) Quantification of atherosclerotic lipid content and representative microphotographs from Oil Red O-stained thoracoabdominal aortas in Apoe−/− mice treated with vehicle (PBS) or TFR cells (TFR cell transfer) under NCD and HCD (n = 5–8 mice/group). (D) Quantification of atherosclerotic lipid content and representative microphotographs of aortic root plaques (Oil Red O staining) in Apoe−/− mice treated with vehicle (PBS) or TFR cells (TFR cell transfer) under NCD and HCD (n = 7 or 8 mice per group/5 slides per mice). Scale bars, 500 μm. Original magnification, ×10. Scale bars, 400 μm. The non-parametric Mann–Whitney U test was used for statistical analysis: *P ≤ 0.05; **P ≤ 0.005; ***P ≤ 0.0005. All data were represented as mean ± SEM.

