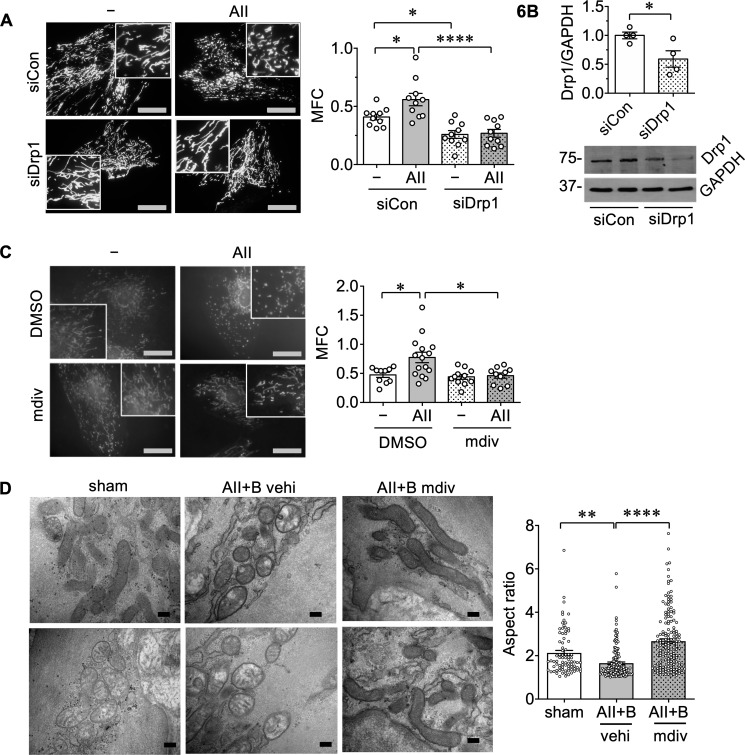
Figure 6.
AngII-induced mitochondrial fission via Drp1 activation. (A) Serum-starved rat abdominal aortic VSMCs infected with adenovirus encoding Drp1 siRNA (siDrp1) or control non-silencing siRNA (siCon) at 100 moi (multiplicity of infection) and the mitochondria-labelling adenovirus, mito-dsRed (10 moi) for 48 h were stimulated with 100 nM AngII (AII) for 2 h. (−) basal control. Mitochondrial fragmentation count (MFC) was calculated using ImageJ analysis. MFC; mitochondria count×100/total mitochondria area (pixcels) per cell was measured. Scale bar is 15 μm and the box is 4× zoomed. Data (mean ± SEM) were from two independent experiments with HPF images, n = 10. Statistical significance was determined by one-way ANOVA with Tukey post hoc test. *P < 0.05 and ****P < 0.0001. (B) Confirmation of Drp1 knockdown in siDrp or siCon adenovirus infected rat aortic abdominal VSMCs by immunoblotting. The adenoviruses (100 moi) were infected for 48 h. For quantification, densitometry analysis was performed and normalized with corresponding GAPDH density. Data are expressed as mean ± SEM. Statistical significance was determined by a two-tailed unpaired Student’s t-test. *P < 0.05 control siCon n = 4 vs. siDrp1 n = 4. (C) Serum-starved rat abdominal aortic VSMCs were pre-treated for 60 min with mdivi1 (mdiv, 20 μM) or its vehicle (0.1% DMSO final) then stimulated with 100 nM AngII (AII) for 2 h. (−) basal control. Mitochondria was stained with MitoTracker Red. MFC was measured. Data were from three independent experiments with HPF images, DMSO—n = 10, DMSO AII n = 15, mdiv—n = 11, and mdiv AII n = 10. Data are expressed as mean ± SEM. Statistical significance was determined by one-way ANOVA with Tukey post hoc test. *P < 0.05. (D) Mice were treated as in Figure 2. Aortic mitochondrial image analysis with transmission electron microscopy. Dissected abdominal aortas from each treatment group (2 sham, 3 AII+B vehi, and 3 AII+B mdiv) were incubated in glutaraldehyde fixative and the mitochondria in the medial layer were imaged by transmission electron microscopy. Scale bar is 200 nm. Aspect ratio was calculated as long axis/short axis of mitochondria by ImageJ analysis. Counted mitochondria numbers in each group were sham n = 83, AII+B vehi n = 164, and 3 AII+B mdiv n = 159. Data are expressed as mean ± SEM. Statistical significance was determined by one-way ANOVA with Bonferroni post hoc test. **P < 0.01 and ****P < 0.0001.

