Figure 4.

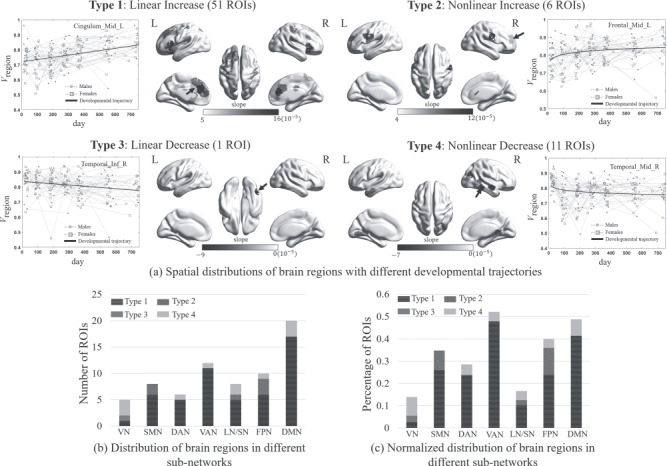
Illustration of developmental patterns of regional-wise FC temporal variability (Vregion) and their spatial distributions, where the brain regions with significant developmental trends (P < 0.05 after FDR correction) were divided into four different categories (Types 1–4) based on their fitted developmental trajectories, including linear increase (Type 1), nonlinear increase (Type 2), linear decrease (Type 3), and nonlinear decrease (Type 4). (a) Spatial distribution of brain regions in each category, where different grayscale values coded different developing velocities (i.e., the slopes of the fitted curves) of Vregion. An exemplary trajectory of Vregion was plotted beside each surface rendering map, with males and females separately plotted by dots and squares. (b) Distributions of four categories of brain regions in different functional brain subnetworks measured by the number of brain regions. (c) Distributions of four categories of brain regions in different functional brain subnetworks measured by the percentage of brain regions. The subnetworks in Figures. (b) and (c) were defined based on the template provided by (Yeo et al. 2014), including visual network (VN), sensorimotor network (SMN), dorsal attention network (DAN), ventral attention network (VAN), limbic/striatum network (LN/SN), frontal–parietal network (FPN), and default mode network (DMN).
