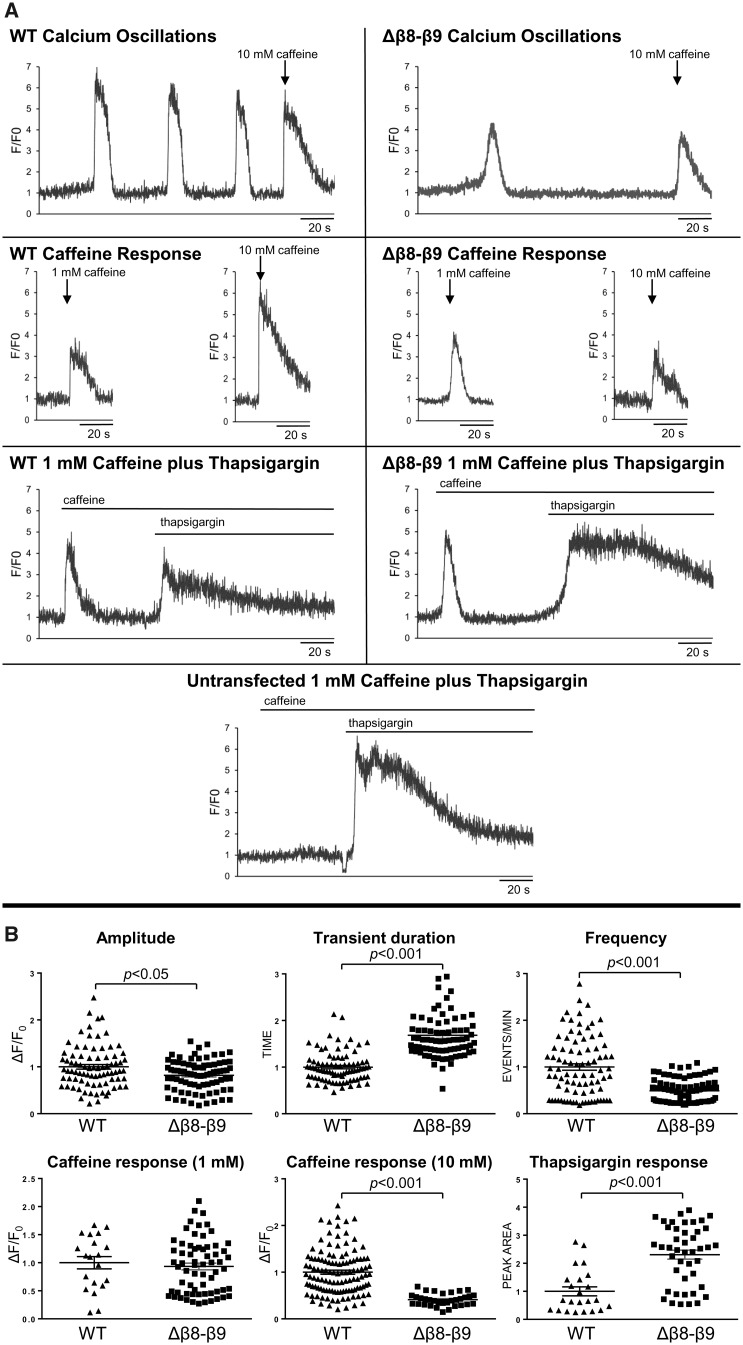
Figure 5.
RyR2Δβ8–β9 displays drastically altered intracellular Ca2± release dynamics. Single-cell Ca2+ imaging using confocal laser scanning microscopy to monitor spontaneous Ca2+ release transient events. (A) Traces from Fluo-3 loaded single HEK293 cells expressing RyR2WT or RyR2Δβ8–β9 showing spontaneous Ca2+ transients and Ca2+ release induced by caffeine (1 mmol/L, 10 mmol/L) or thapsigargin (1 μmol/L). (B) Ca2+ transient characteristics, including amplitude, duration, and frequency of events, were analysed for 84 cells expressing RyR2WT and 81 cells expressing RyR2Δβ8–β9 from four separate experiments, whereas the caffeine response for at least 20 cells. The ER Ca2+ store content was measured by integration of the (1 μmol/L) thapsigargin-induced Ca2+ release (following 1 mmol/L caffeine application) at the end of each experiment. Data are normalized for RyR2WT and expressed as mean value ± SEM; statistical analysis was carried out using Mann–Whitney test.

