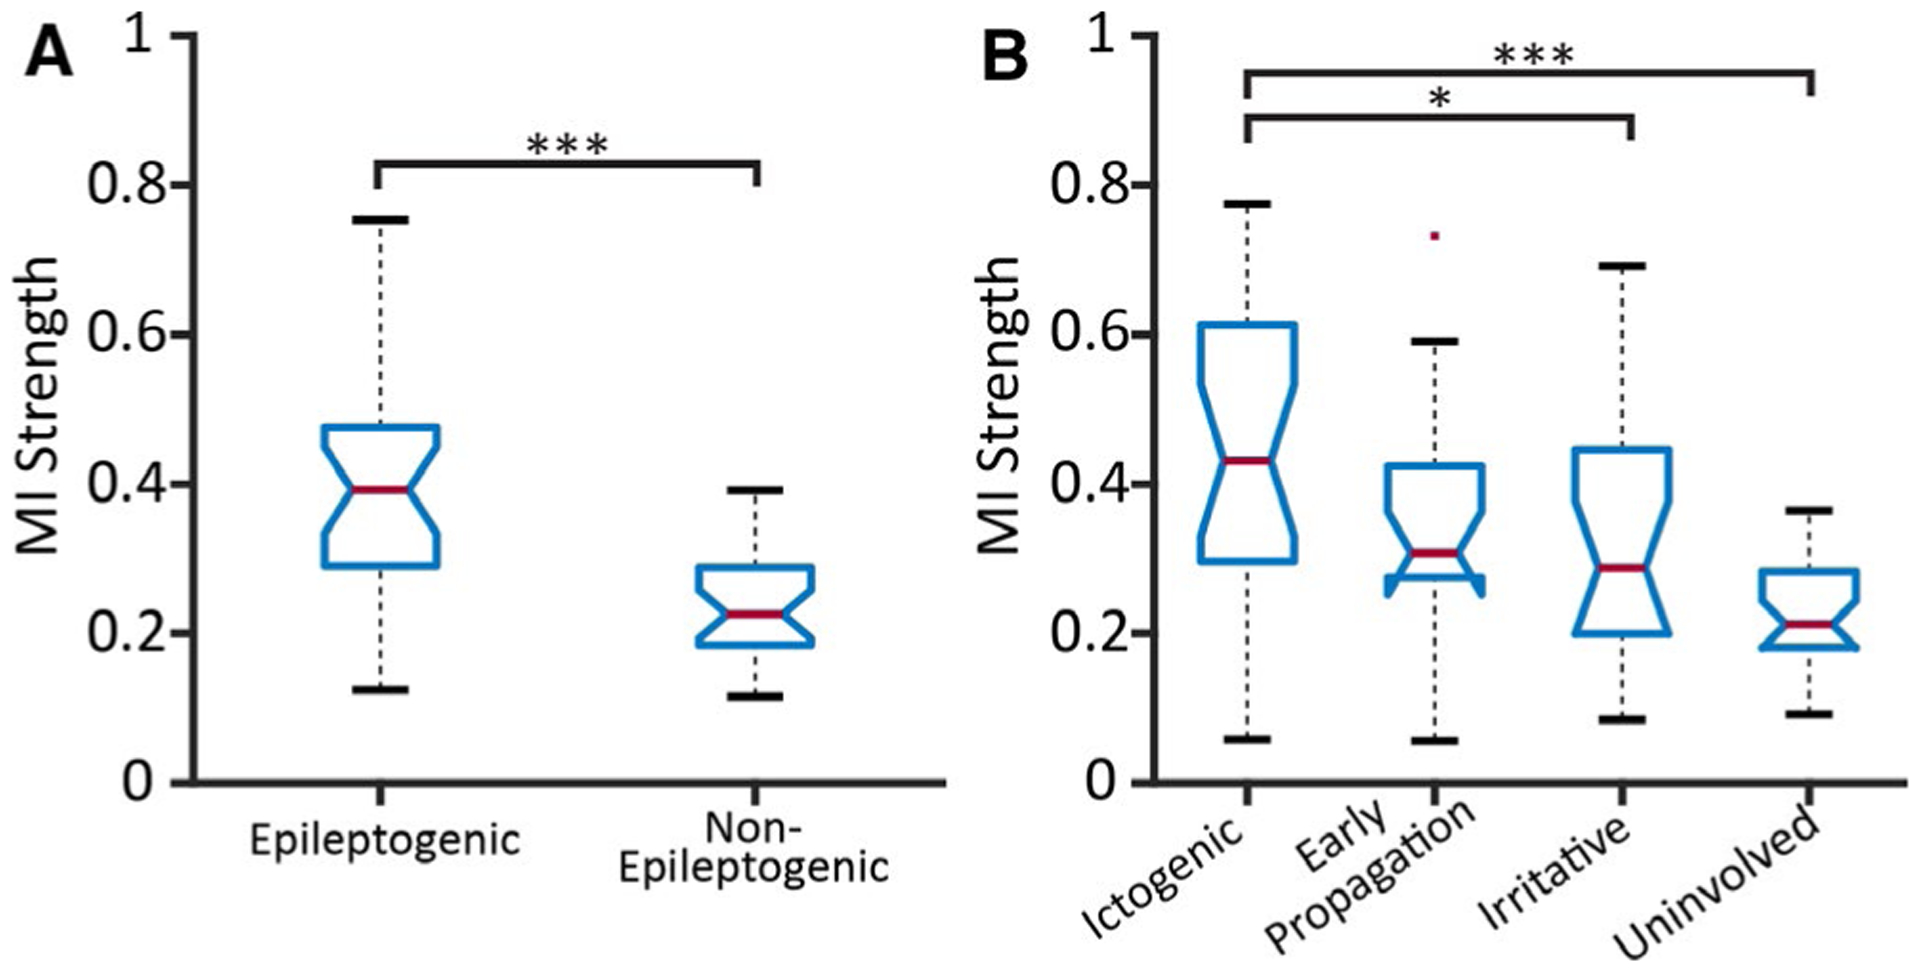
FIGURE 1.

Brain regions with greater epileptogenicity demonstrate higher mutual information (MI) strength. A, MI strength in epileptogenic regions (mean ± standard deviation) (0.40 ± 0.14) is higher than in nonepileptogenic structures (0.24 ± 0.07), using a dichotomized classification scheme of epileptogenicity (paired-sample t test). B, MI strength was compared between regions using four categories of epileptogenicity using a one-way analysis of variance (ANOVA) with Tukey’s honest significant difference criterion (THSDC) post hoc. MI strength of ictogenic regions (0.45 ± 0.20) was higher than irritative (0.31 ± 0.17) and uninvolved (0.22 ± 0.07) regions. In both panels, the central red line represents the median, and the top and bottom lines indicate the 75th and 25th percentiles, respectively. The red dots represent outliers, and the whiskers visualize the extremes of the data. (N = 25 focal epilepsy patients.) *P < .05, **P < .01, ***P < .001 with Bonferroni-Holm correction for multiple comparisons for t tests, where applicable
