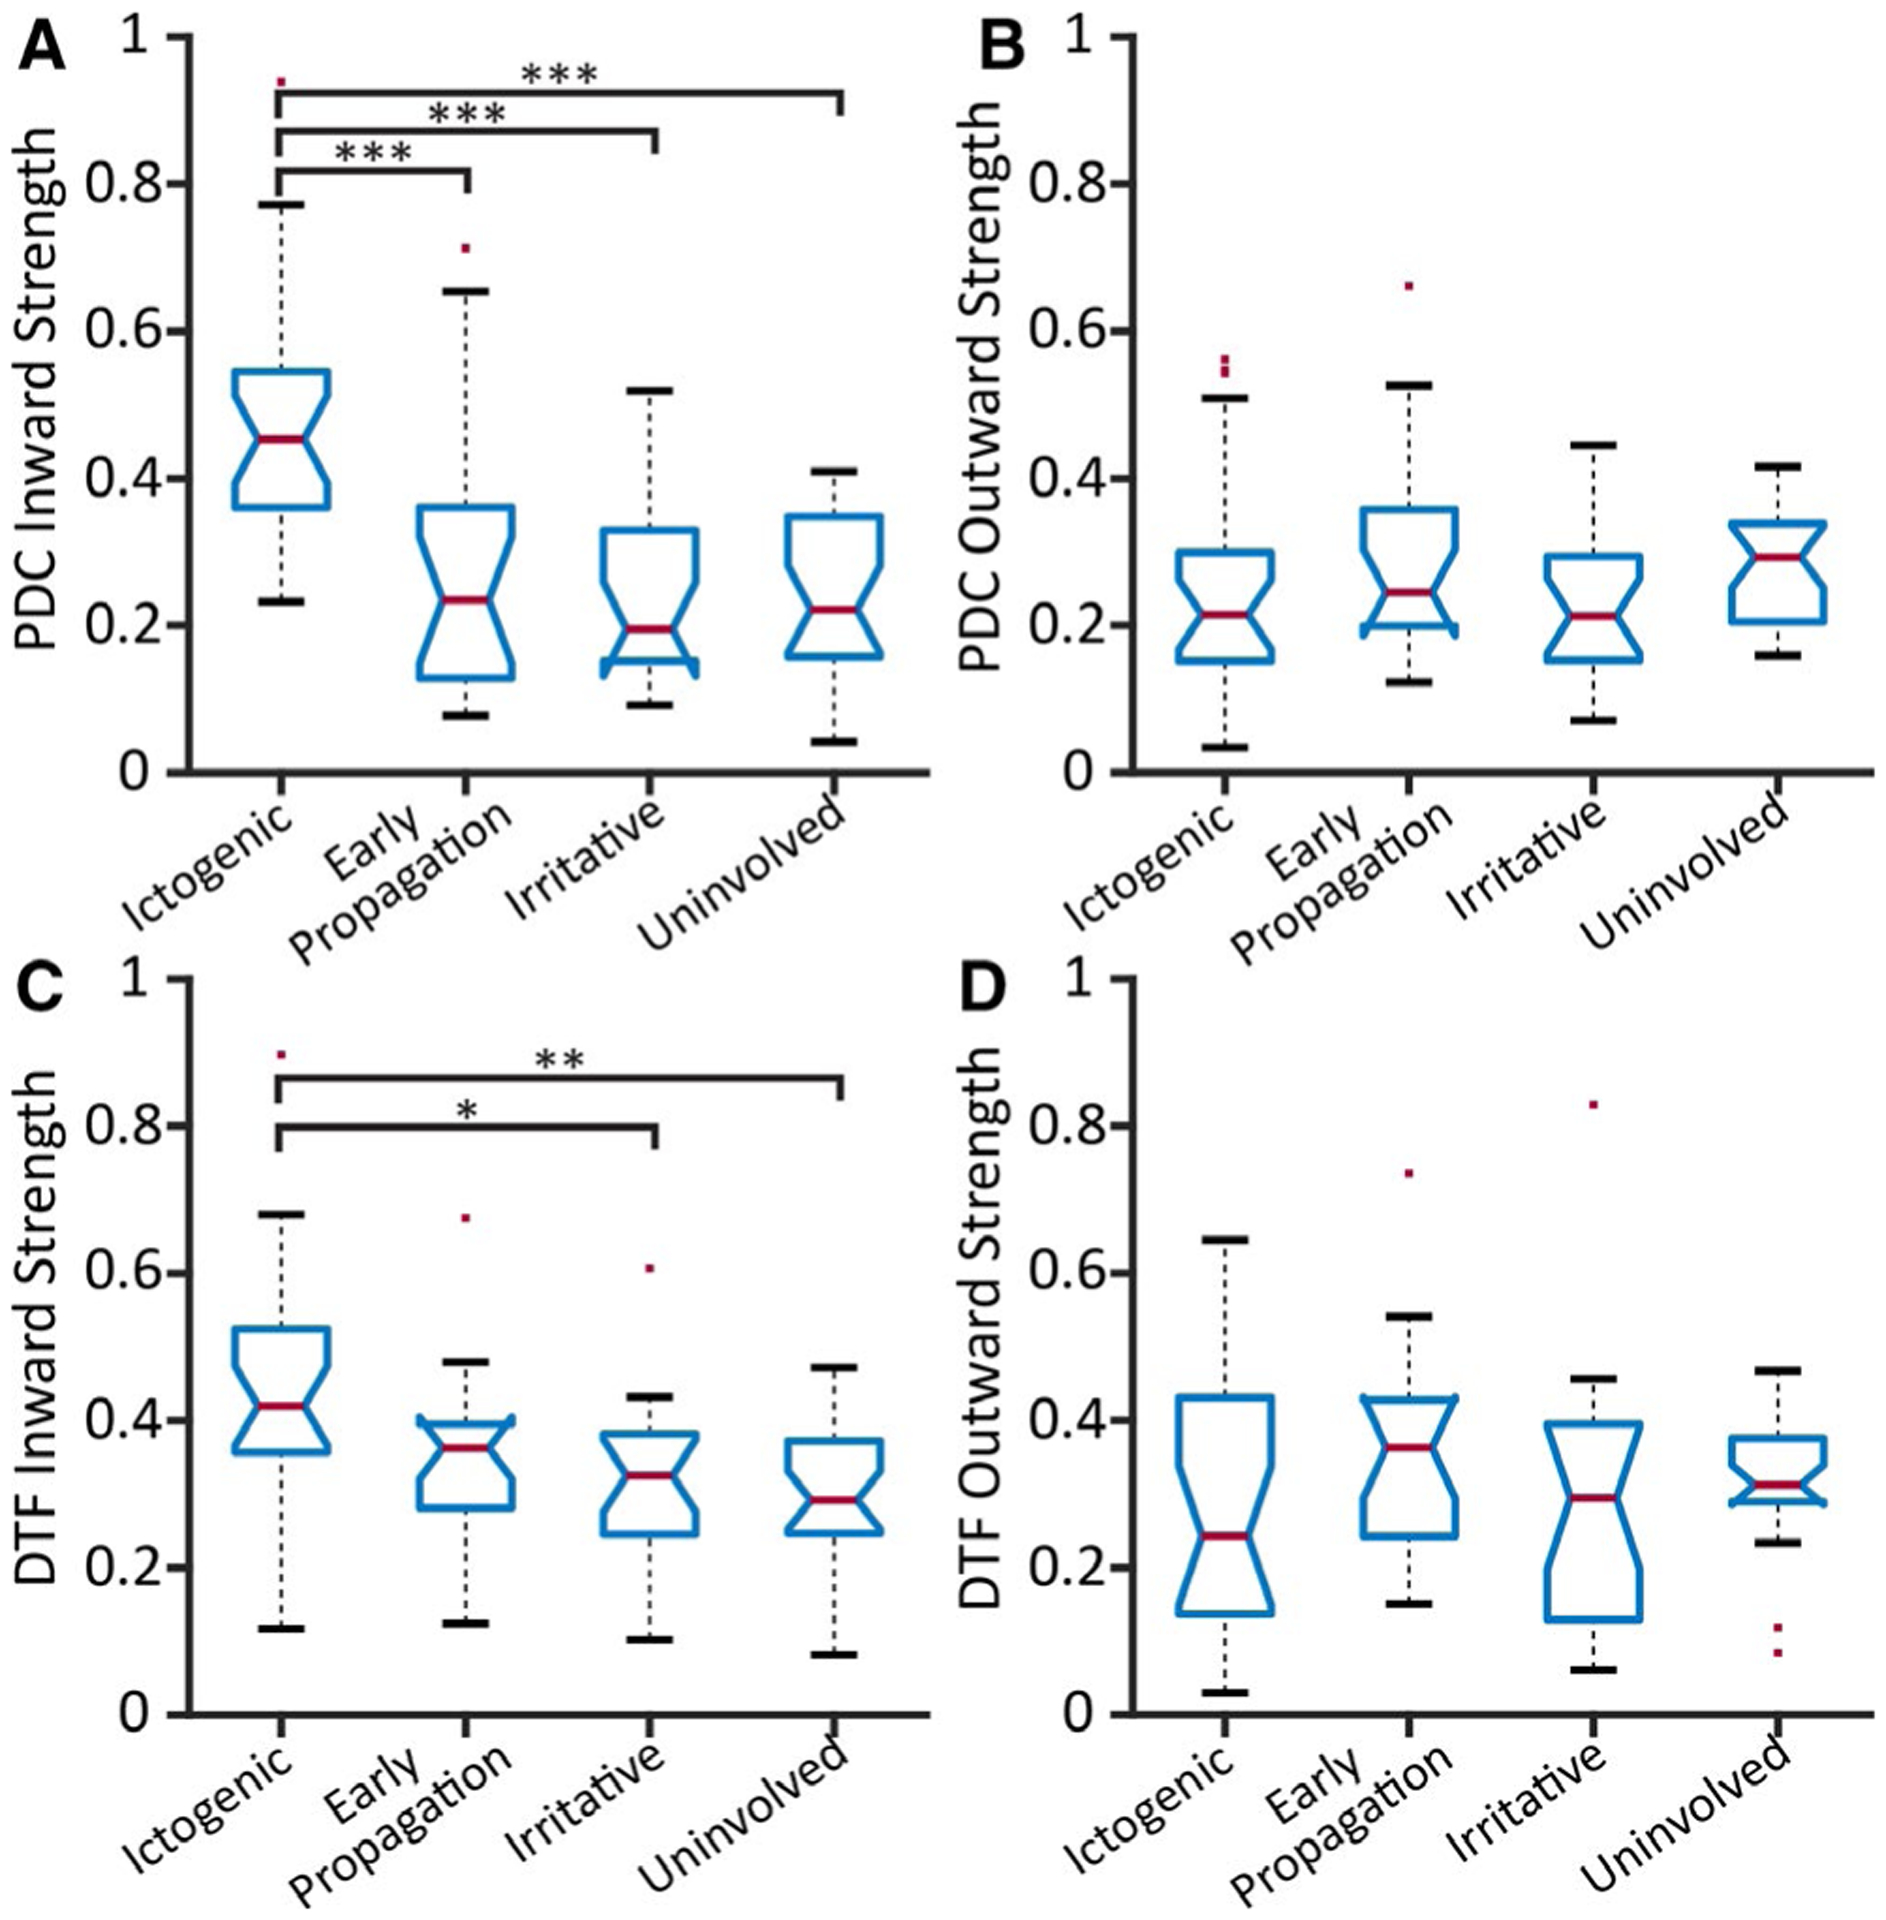
FIGURE 3.

Ictogenic regions demonstrate higher inward but not outward directed connectivity. Strengths of PDC inward (A), PDC outward (B), DTF inward (C), and DTF outward (D) are shown across all patients. Ictogenic regions demonstrate higher inward strength (A, C) but not outward strength (B, D) using both directed connectivity measures. The PDC inward strength values (mean ± standard deviation) are: ictogenic (0.47 ± 0.17), early propagation (0.28 ± 0.19), irritative (0.24 ± 0.12), and uninvolved (0.25 ± 0.11). The DTF inward strength values are: ictogenic (0.43 ± 0.16), early propagation (0.35 ± 0.12), irritative (0.32 ± 0.11), and uninvolved (0.30 ± 0.10). In all four panels, the central red line represents the median, and the top and bottom lines indicate the 75th and 25th percentiles, respectively. The red dots represent outliers, and the whiskers visualize the extremes of the data. (N = 25 patients.) *P < .05, **P < .01, ***P < .001, one-way ANOVA with THSDC post hoc. DTF = directed transfer function, PDC = partial directed coherence
