Figure 5.

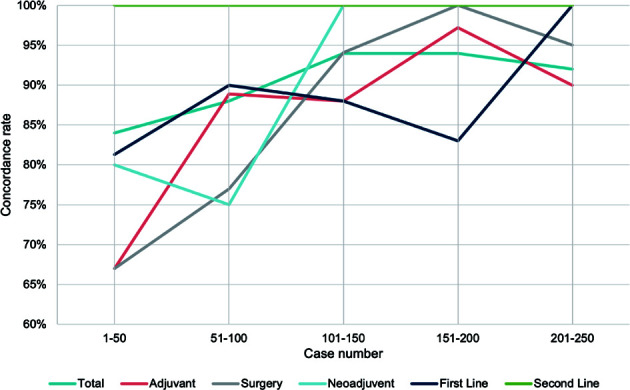
Timeline visualization of the changes in concordance rate. Trend curve of concordance rate in every 50 patients grouped by treatment strategy.

Timeline visualization of the changes in concordance rate. Trend curve of concordance rate in every 50 patients grouped by treatment strategy.