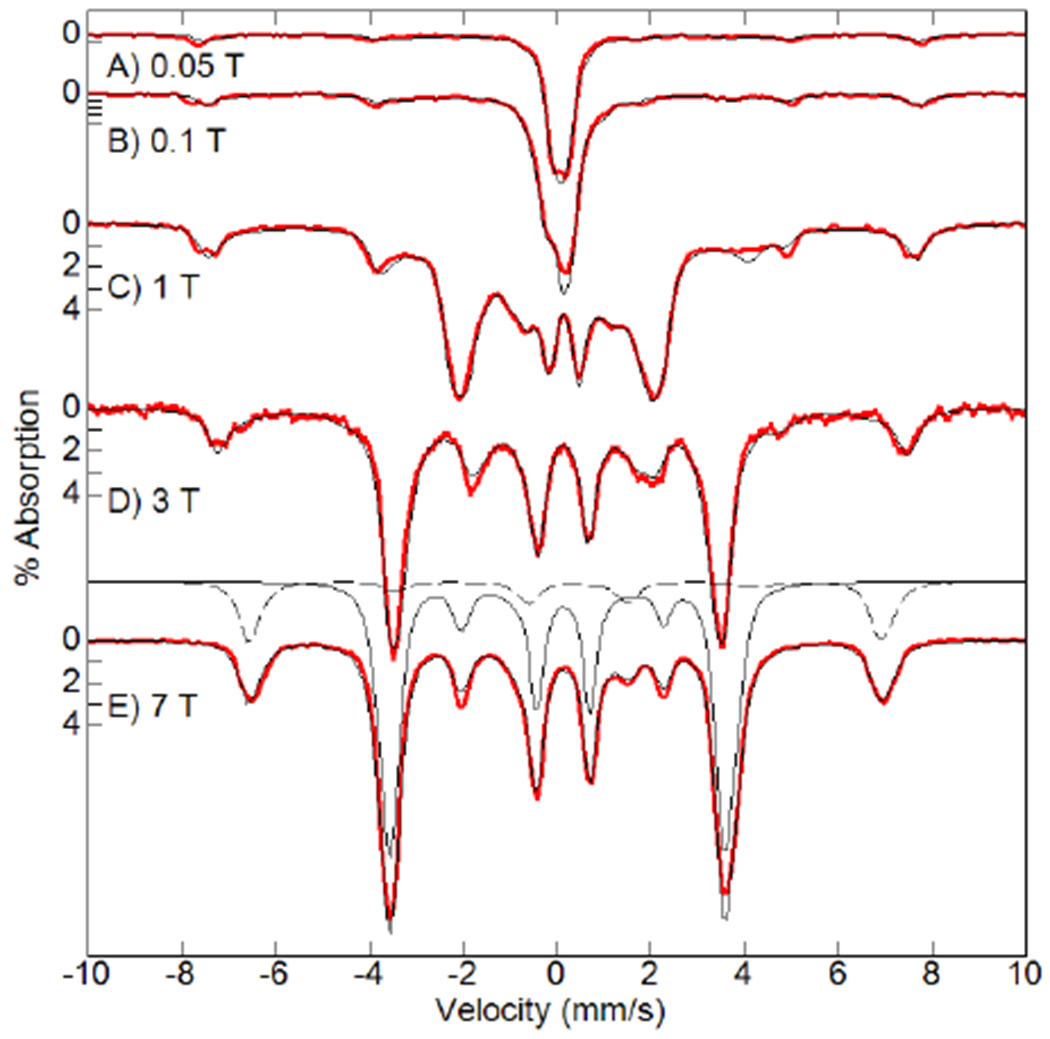
Figure 3.

Mössbauer spectra of [FeIVpoat(O)]− (red traces, 4.2 K) and simulations (black traces) at the magnetic fields listed. Each simulation is the sum of S = 2 (80%) and S = 5/2 (20%) species. One set of simulations of the individual species is shown for the spectrum recorded at 7 T (solid trace is S = 2 and dashed trace is S = 5/2). S = 2 parameters: D = +5.1(3) cm−1, E/D = 0.03, A = (−15 −16 −28) T, δ = 0.11 mm/s, ΔEQ = +0.27 mm/s, η = 0.04. S = 5/2 parameters: D = +1.0 cm−1, E/D = 0.33, Aiso = −20 T, δ = 0.32 mm/s, ΔEQ = 0.80 mm/s, η = 0.03.
