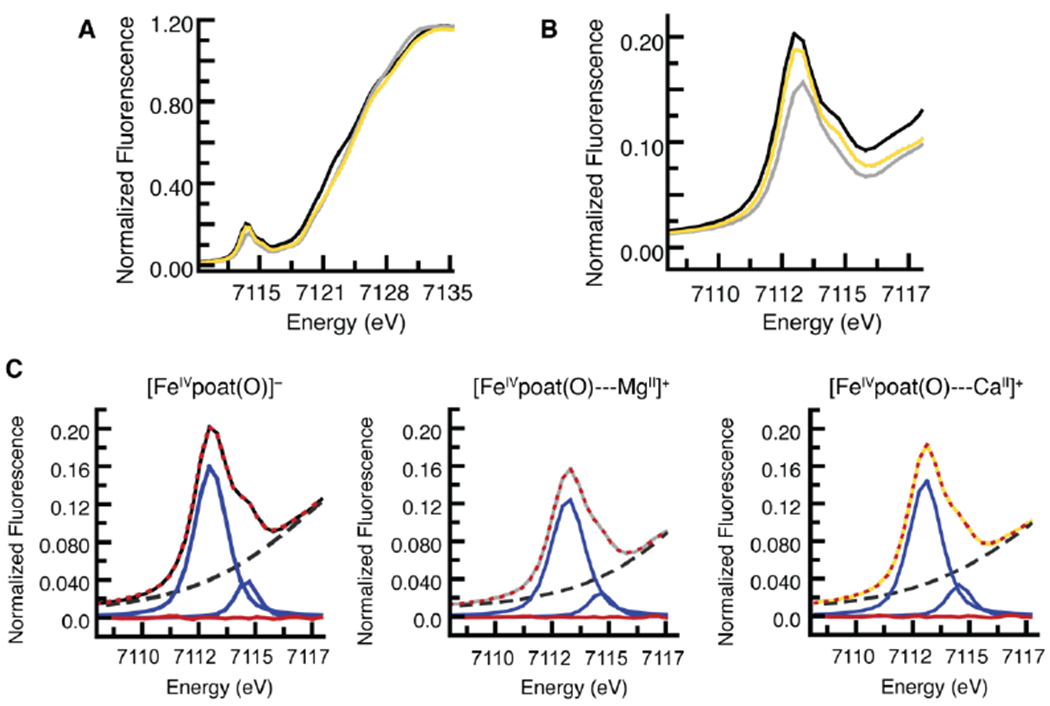
Figure 9.

Experimentally observed pre-edge and XANES of the XAS spectra for [FeIVpoat(O)]− (black), [FeIVpoat(O)---MgII]+ (gray), and [FeIVpoat(O)---CaII]+ (gold) (A); the pre-edge region (B); and analysis of the pre-edge peaks (C). Experimental data in C are represented by the same colored spectra as in B, the best fits as dotted red lines, the modeled baselines as black dashed lines, the fitted component peaks as blue lines, and the residuals as red lines.
