Figure 3.

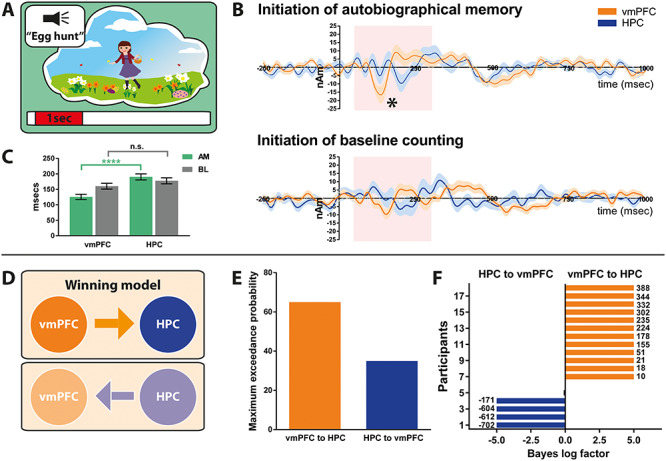
Initiation of AM retrieval. (A) Schematic of the <1-s AM retrieval initiation period under consideration. (B) Event-related signals for AM retrieval and baseline counting for the vmPFC (in orange) and the left hippocampus (in blue). The continuous lines represent the mean and the shaded areas around the lines represent the SEM. The pink shaded boxes highlight the period from 50 to 300 ms in which the maximum response was examined. * = significant difference between the vmPFC and the left hippocampus engagement. (C) Bar graph displaying the means and SEM of the maximum responses for AM retrieval (green) and baseline counting (grey) for the vmPFC and the left hippocampus. Whereas during AM retrieval, the maximum vmPFC response occurred around 100 ms after cue onset, the maximum response of the left hippocampus occurred reliably later; *** = P < 0.0001. No such temporal order effect was observed during baseline counting. (D) Two proposed models of effective connectivity between the vmPFC and left hippocampus. (E) Results of Bayesian model comparison indicated a stronger influence of the vmPFC on left hippocampal activity during AM retrieval initiation. (F) Log Bayes factor for each participant. Orange bars indicate positive to strong evidence for the vmPFC driving left hippocampal activity, the model which was most consistent across participants. Blue bars represent the four participants where evidence of the left hippocampus driving vmPFC activity was observed. Black bars show the remaining two participants where there was no conclusive evidence for either model. Where the log Bayes factor exceeded 5, bars are truncated, and exact values are adjacently displayed. AM = Autobiographical memory, BL = baseline counting, vmPFC = ventromedial prefrontal cortex, HPC = hippocampus.
