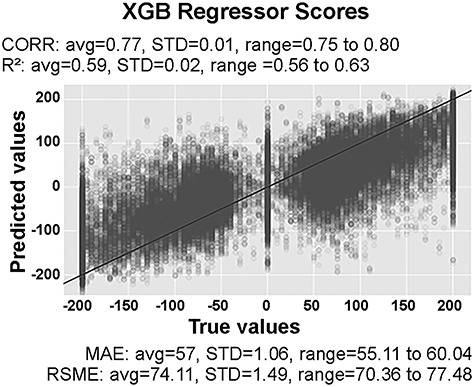
Figure 4.

Model performance. True food ratings versus predicted food ratings. The black line (45° line) represents the theoretical optimal performance, and hence, all true ratings equal the predicted ratings. Ratings off the black line indicate prediction error. The farther away, the greater the error. Predictions were carried out with 50 extreme gradient-boosted (XGB) tree models in a cross-validation procedure. Average (avg), SD, minimum, and maximum of the 50 XGB model’s performance are reported in terms of their mean absolute error (MAE), root mean squared error (RMSE), correlation (CORR) between true values and predicted values, and R2 of true values and predicted values.
