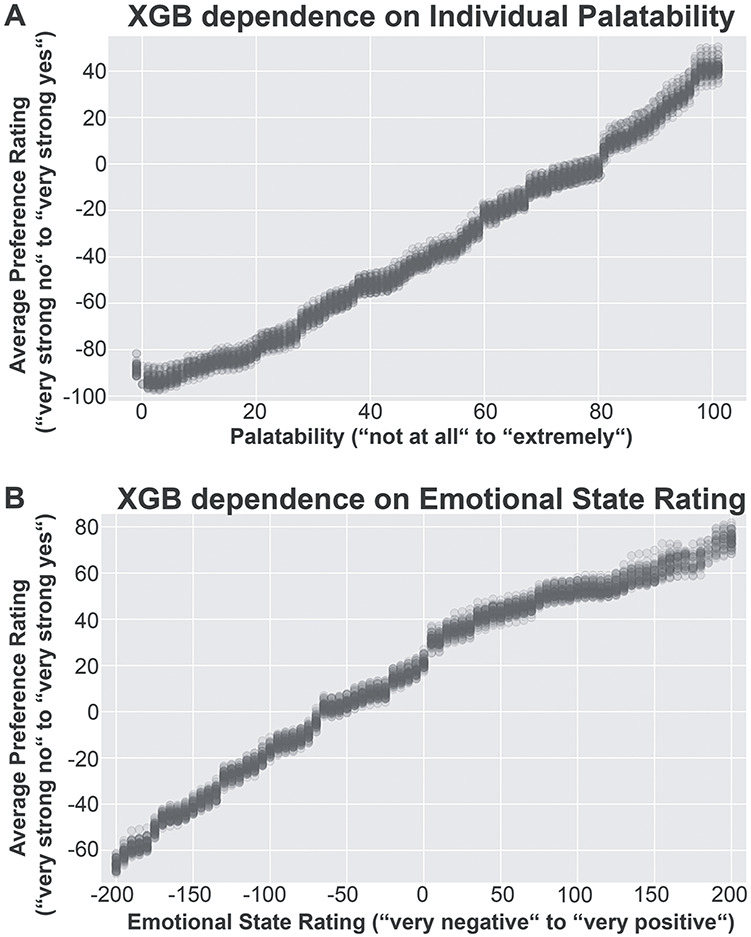
Figure 6.

Distribution of the dependence of the extreme gradient-boosted (XGB) tree models’ predictions on the values of the factors. In a holdout data-set, the values of a single variable were replaced by a grid of possible values, and then this data-set was used to compute predictions. The influence of the other variables was mitigated by averaging over the model’s predictions. Average predictions over the value range of each factor were calculated for each holdout data-set in the main cross-validation loop of the analysis, leading to 50 average prediction per value per factor. The two best predictors are shown: (A) individual palatability and (B) emotional state rating.
