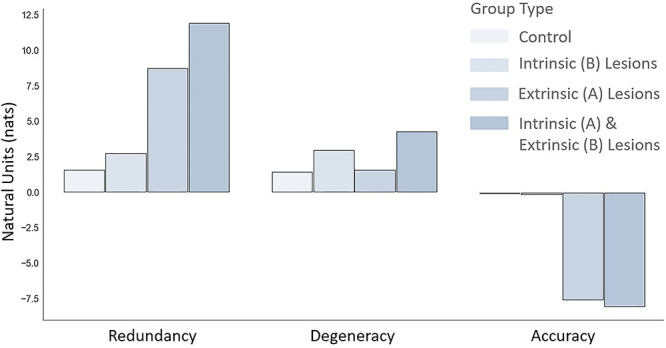
Figure 7.

Effects of lesions. This bar chart reproduces some of the data in Table 1 to highlight the effects of combined (extrinsic and intrinsic) disconnections on redundancy, degeneracy, and accuracy. Note that these measures are directly interpretable in terms of their statistical evidence. By convention, a difference in log evidence (i.e., a log Bayes factor) of three is considered strong evidence (corresponding to a log odds ratio of 20:1) (Kass and Raftery 1995). Please see Figure 8 for a more comprehensive analysis of (behavioral and statistical) accuracy.
