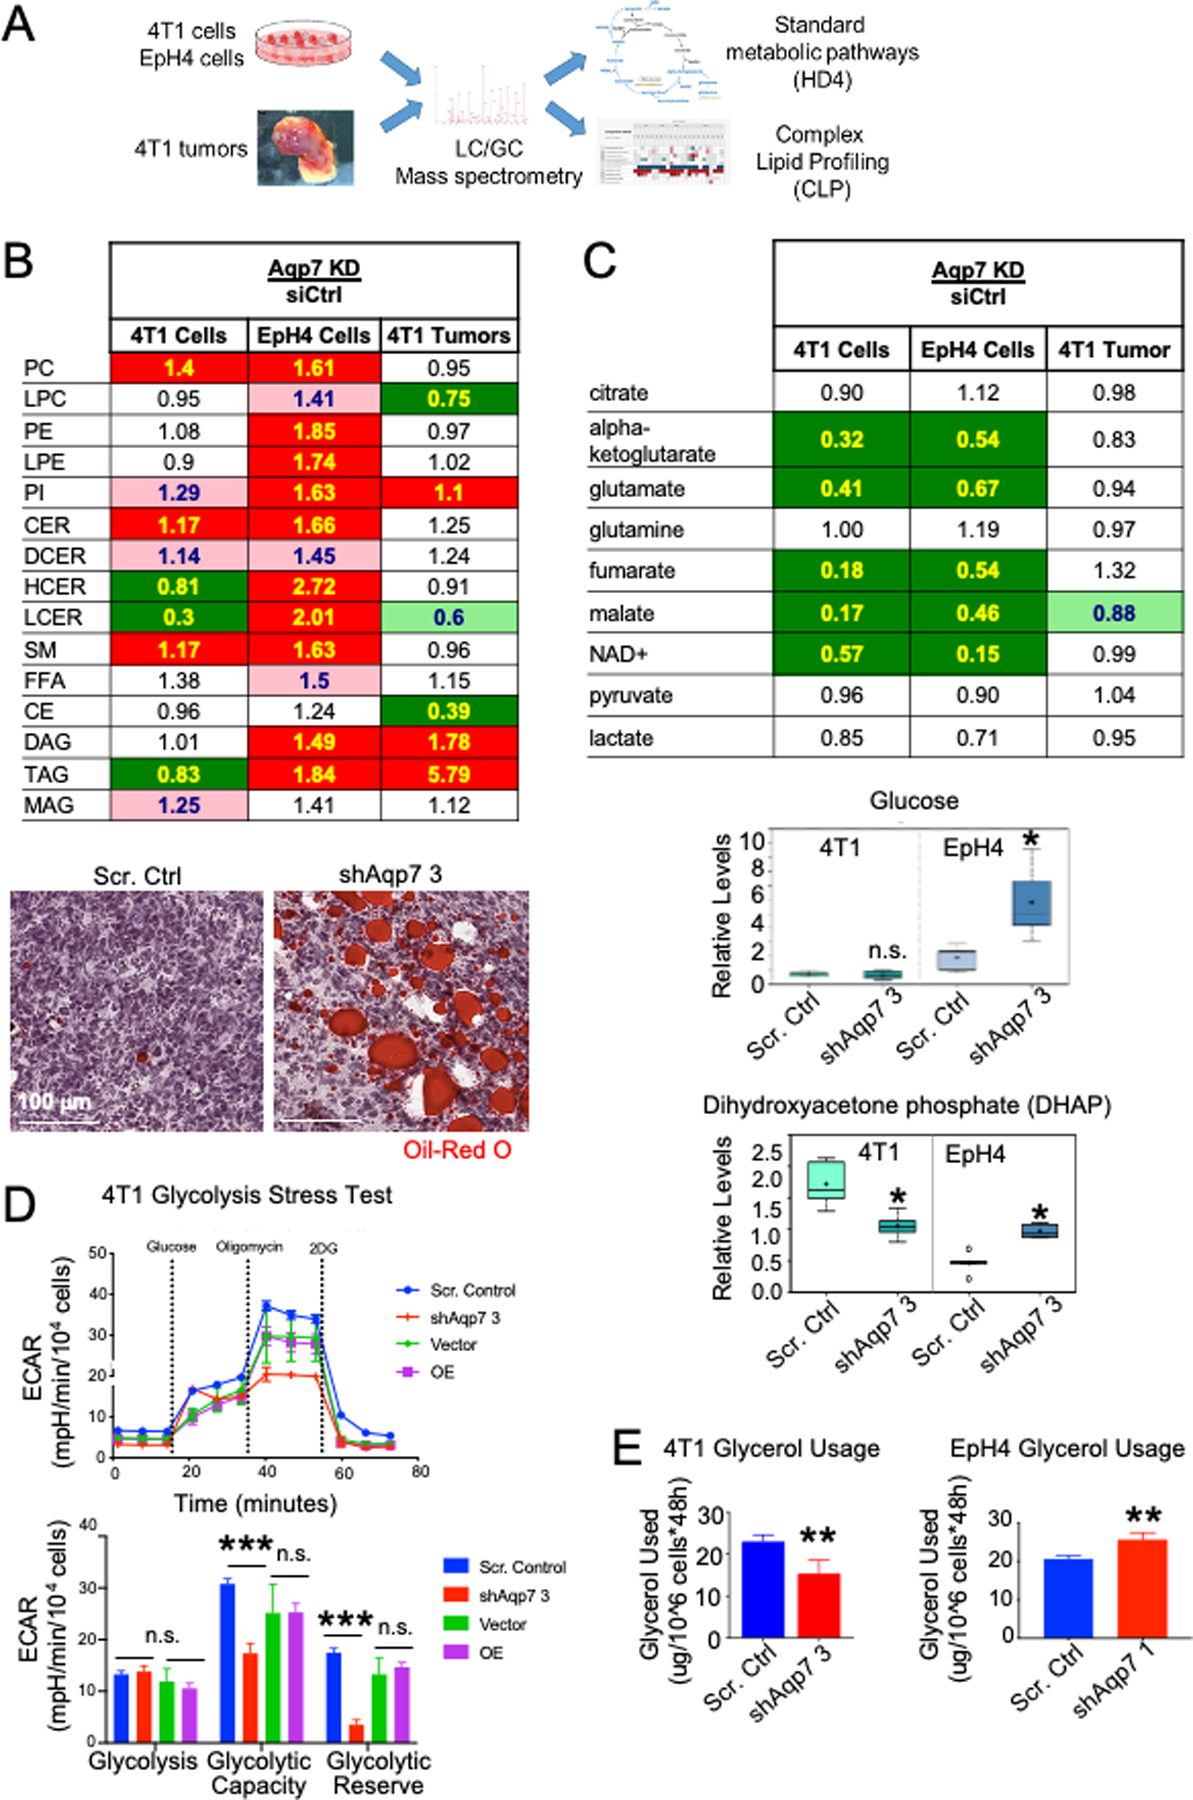
Figure 4. Aqp7 knockdown leads to changes in lipid metabolism and carbohydrate metabolism.

(A) Experimental overview of standard metabolomics and complex lipid profiling conducted on Aqp7 KD and scrambled control samples from EpH4 and 4T1 MECs and 4T1 tumors. (B) (Top) Total complex lipid levels in cell lines and tumors. Numbers indicate the ratio of lipid levels in Aqp7 KD compared to scrambled control. In B-C, cell colors indicate significant increase (red; p<0.05, Welch’s t-test), decrease (green) in the knockdown group, or approaching significance (faded; 0.05<p<0.10). (Bottom) Oil Red O staining of tumors of scrambled control and Aqp7 KD 4T1 cells. (C) (Top) TCA cycle metabolomics of cell lines and tumors. (Bottom) Glucose and DHAP levels in 4T1 and EpH4 cells. (D) Glycolysis stress test. Representative assay quantification of ECAR in 4T1 Aqp7 KD or OE, compared to controls (scrambled and vector, respectively). Error bars depict s.d. of four independent wells from a representative tracing from three independent experiments. (E) Glycerol usage in EpH4 and 4T1 cells after Aqp7 KD or scrambled control.
