
Figure 5. Aqp7 knockdown leads to decreased oxidative stress tolerance.
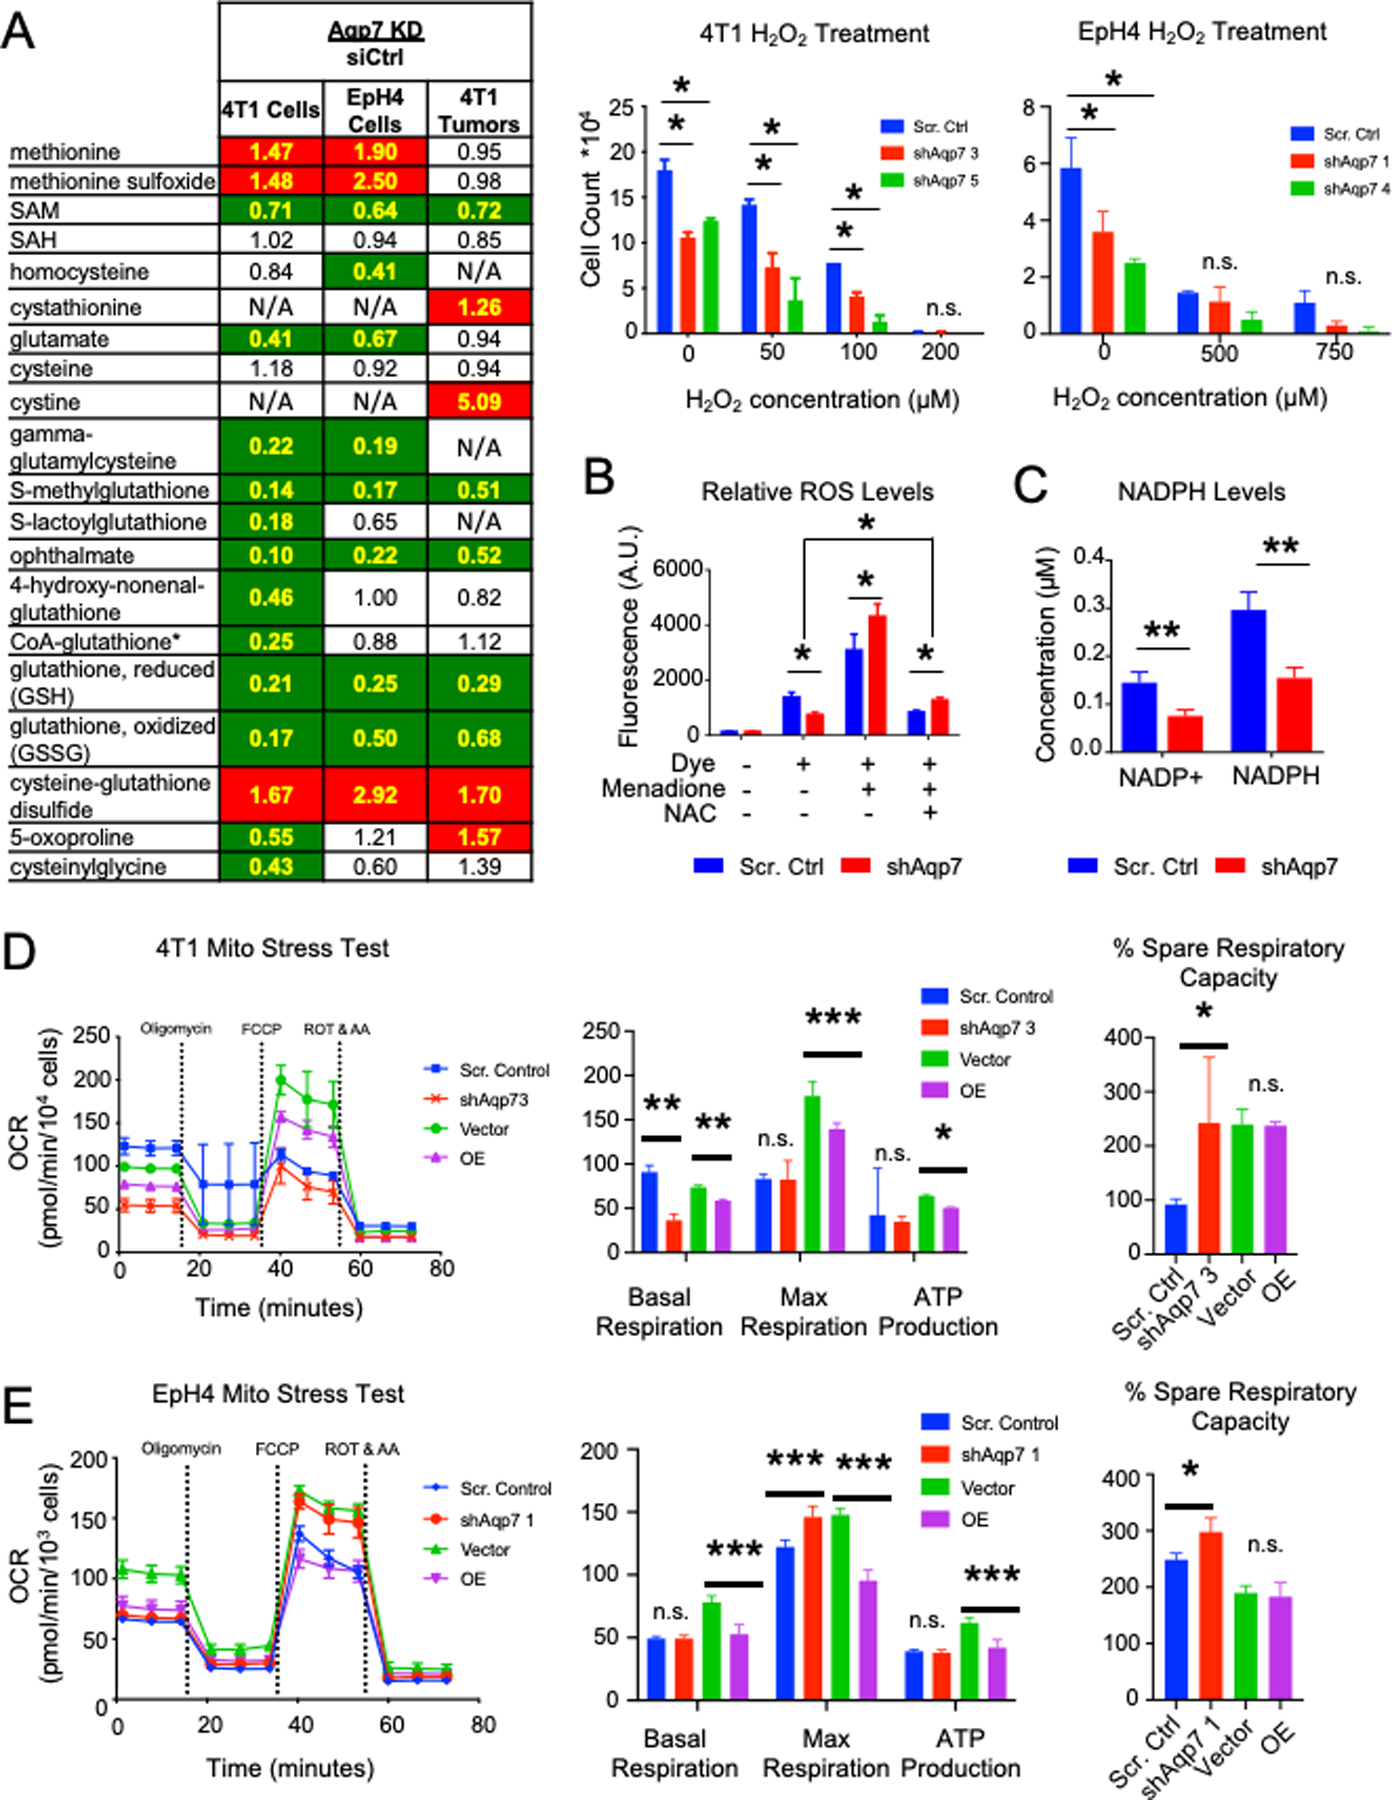
(A) (Left) Metabolomics of glutathione and related metabolites following Aqp7 KD compared to scrambled control in cells and tumors. Numbers indicate the ratio of metabolite levels in Aqp7 KD compared to scrambled control. Cell colors are described in Figure 4. (Right) Oxidative stress tolerance assay reveals lowered tolerance to H2O2 following Aqp7 KD in 4T1 and EpH4 cells. (B) ROS levels in 4T1 scrambled control and Aqp7 KD cells after treatment with ROS inducer menadione or N-acetyl cysteine supplementation. (C) NADP+ and NADPH levels in 4T1 Aqp7 KD cells compared to scrambled control. (D–E) Mitochondrial stress test. Representative assays showing changes in OCR in 4T1 (D) and EpH4 (E) cells and measurement quantification. Error bars depict s.d. of four independent wells from a representative tracing from three independent experiments.